
Learning about server performance can be very helpful, especially if you're running resource-hungry applications. One way to improve performance is to tweak the BIOS settings. In this article, we will try to answer the question of whether DAPC is really more cost-effective than default BIOS performance.
Our company — is a hoster, and this largely determines the specifics of the work tasks of the DevOps and Support department. However, relatively recently, the usual routine of our work was interrupted by a sudden question: it was necessary to determine whether the use of Performance per Watt (DAPC) in practice allows us to reduce processor power consumption and, as a result, the load on the cooling system in the data center.
DAPC (Dynamic Application Power Management) is a BIOS feature that automatically adjusts power consumption depending on the load. That is, when you are not using the server, it will consume less power, which can result in significant energy savings. In addition, DAPC can improve server performance in low load mode by running the processor at a higher frequency.
BIOS default performance is a BIOS setting that sets the processor to its maximum frequency, regardless of the load. This can improve performance under a heavy load, but also it can increase power consumption and computer temperature.
The differences between the power profiles are detailed in the Dell technical documentation.
Theoretically, the choice between DAPC and BIOS default performance depends on your needs. If you want to save energy and improve performance in low-load mode, choose DAPC. If you're looking for maximum performance under a heavy load, BIOS default performance is the way to go.
Well, let's take a look at how it works in practice.
We used the stress-ng ? AIDA64 for the test.
Testing environment
| Platform | Dell PowerEdge R720 12xLFF | CPU | 2xXeon 2xE5-2680v2 2.8GHz (10 cores) |
|---|---|
| RAM | 8x16 Gb DDR3 REG | Hard Drive | 1x960Gb SSD |
| Controller | 1xDell PERC H710 Mini | Motherboard | DELL PE R720 MB |
CPU
To begin with, we tested the processor:
stress-ng --cpu 40 --cpu-method matrixprod --metrics --timeout 60The test involves 40 processor threads, and the duration of the test is 60 seconds.
| stressor | real time (secs) | sys time (secs) | |
| BIOS default performance | cpu | 60 | 0 |
| BIOS (DAPC) | cpu | 60 | 0 |
The BIOS default performance outperformed the DAPC in all measured parameters, with the exception of the total test execution time. Bogo ops/s (real time) is a key metric for this test, because this parameter reflects the number of test iterations performed per second and allows you to judge processor performance while testing.
Comprehensive testing
As part of this test, the indicators of several key subsystems are measured:
stress-ng --cpu 40 --io 4 --vm 1 --vm-bytes 128G --timeout 60s --metrics-brief| stressor | bogo ops (secs) | real time (secs) | usr time (secs) | sys time (secs) | bogo ops/s (real time) | bogo ops/s (usr+sys time | |
| BIOS default performance | cpu | 1571925 | 60 | 2192.06 | 0 | 26197.69 | 717.1 |
|---|---|---|---|---|---|---|---|
| io | 1475056 | 60 | 16.21 | 185.72 | 24584.24 | 7304.79 | |
| vm | 0 | 10.13 | 0 | 0 | 0 | 0 | |
| BIOS (DAPC) | cpu | 1563342 | 60 | 2196.55 | 0 | 26054.87 | 711.73 |
| io | 1484777 | 60 | 16.14 | 180.61 | 24746.26 | 7546.52 | |
| vm | 10.14 | 0 | 0 | 0 | 0 |
- The CPU stressor creates a load on the processor, which allows you to evaluate how well the system copes with computing tasks. CPU stressor-related metrics can include operations per second, execution time, and CPU utilization.
- An IO stressor creates a load on the disk subsystem, which allows you to evaluate how well the system copes with I / O operations. Metrics associated with an IO stressor can include data transfer rate, I/O time, and other metrics related to the disk subsystem.
- The VM stressor puts a load on virtual memory, which allows you to evaluate how well the system is doing with memory management and memory page processing. Metrics associated with a VM stressor can include operations per second, execution time, and memory usage.
It is easy to see that these test results are practically independent of the power management method.
Power Consumption Comparison
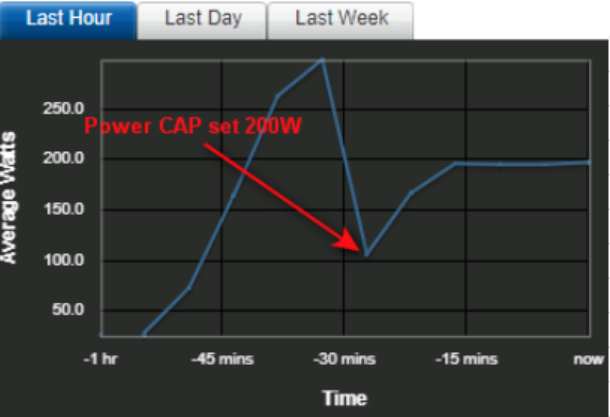
Enabling the Power CAP policy improves the efficiency of workflows in computer systems by setting the maximum value for system power consumption, which helps prevent exceeding the maximum allowed power consumption level and reduces the risk of overheating. This is especially important for systems running a high load, such as servers or compute clusters.
For clarity, we conducted the tests without an established power consumption policy and with a limit of 200 watts.
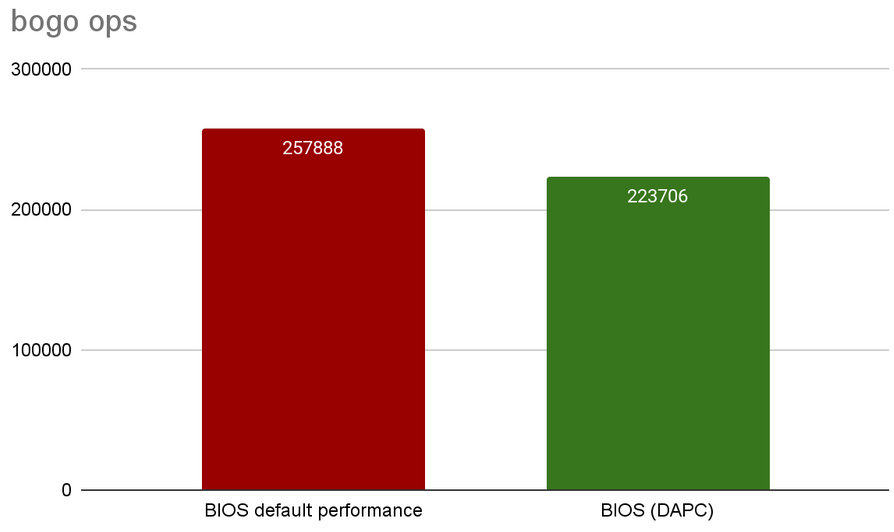
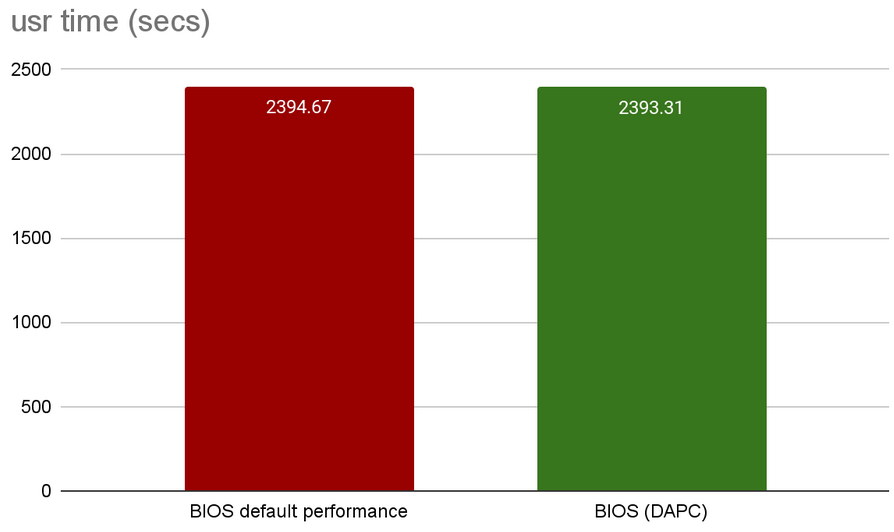
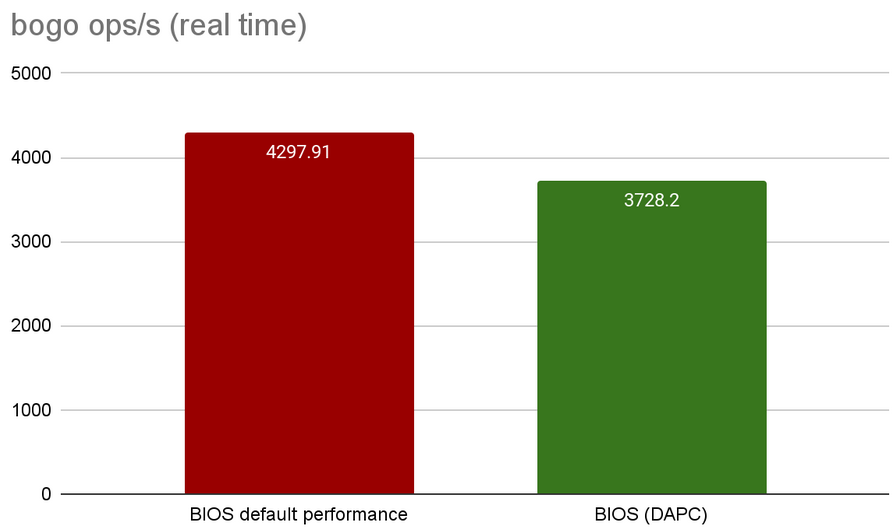
stress-ng --cpu 40 --io 4 --vm 1 --vm-bytes 128G --timeout 30mWithout the policy set, the following results were obtained:
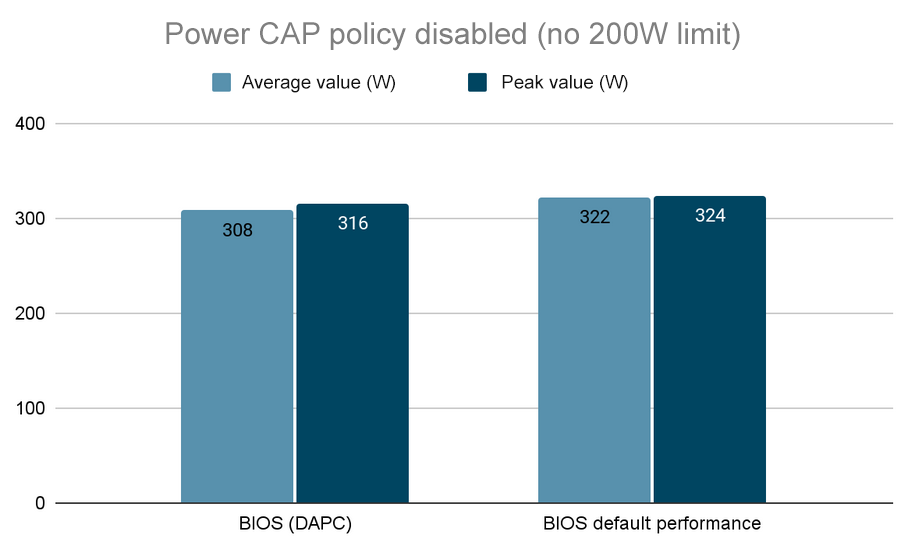
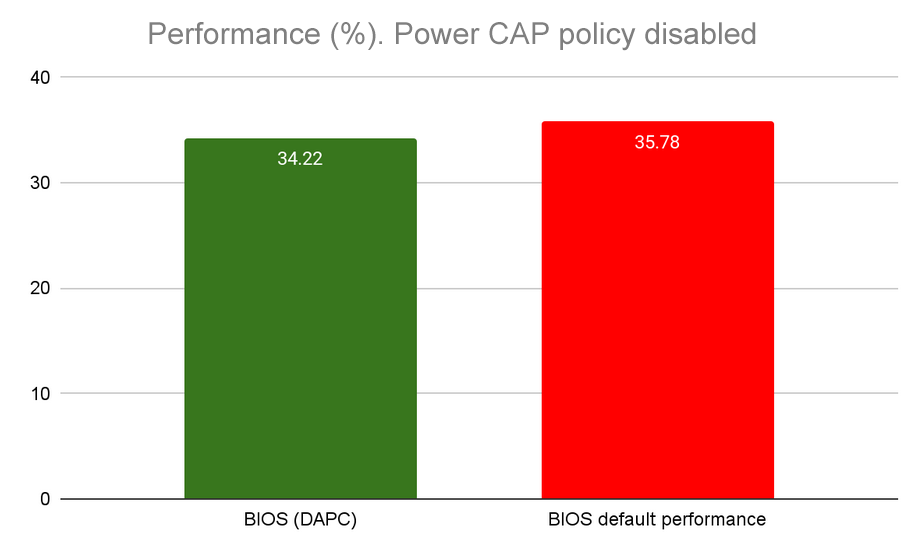
The test showed that with a slight decrease in power consumption (308 vs. 322 W), the DAPC performance is significantly (about 10%) lower compared to the BIOS default performance.
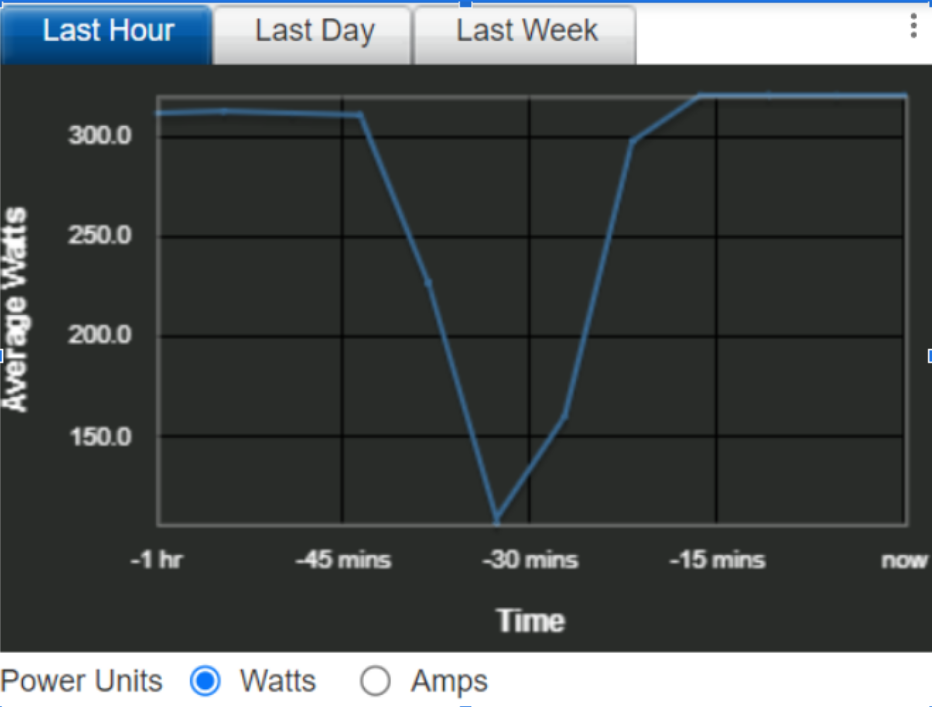
After that, we applied a limit of 200 watts:
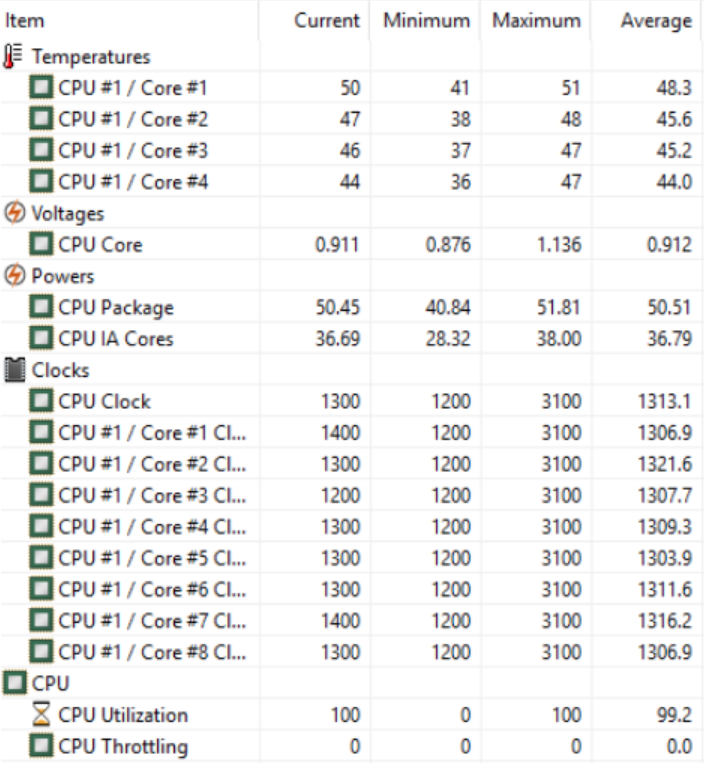
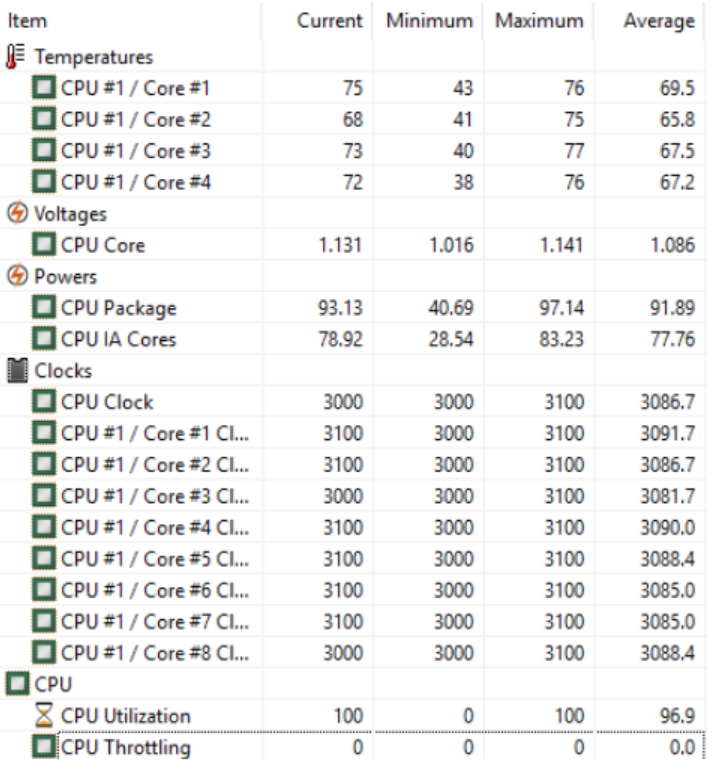
Processor and component temperatures are important because high temperatures can cause system overheating and component damage, and high power consumption can increase the cost of work tasks.
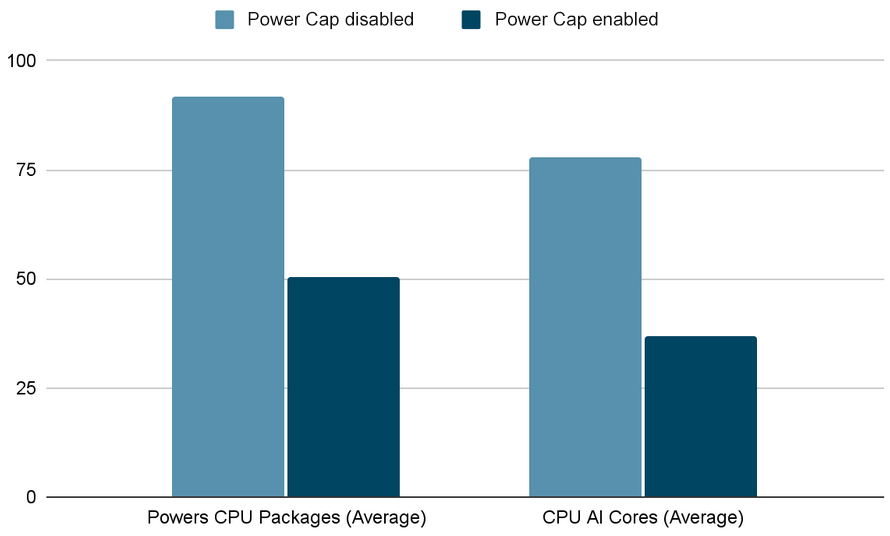
The CPU Package metric reflects the total power consumption of the processor. If this value is too high, it may indicate that the processor is under a heavy load or that the system needs additional ventilation. Processor core indicators (CPU IA Core) display the temperature of the computing cores. These metrics can help identify problems with individual processor cores, such as utilization, uneven usage, and so on. Using the Power CAP policy can significantly reduce the load on the processor cores (by about 40%).
The processor core voltage (CPU Core Voltages) with and without the Power CAP policy set differ by about 15% (0.912 and 1.086, respectively).
RAM testing
stress-ng --sequential 0 --class io --timeout 60s --metrics-brief| stressor | bogo ops (secs) | real time (secs) | usr time (secs) | sys time (secs) | bogo ops/s (real time) | bogo ops/s (usr+sys time) | |
| BIOS default performance | aio | 49659629 | 60 | 162.1 | 450.83 | 827650.72 | 81020.07 |
|---|---|---|---|---|---|---|---|
| aio | 17264.35 async I/O signals per sec (average per stressor) | ||||||
| aiol | 430590 | 60.03 | 41.57 | 54.06 | 7172.47 | 4502.67 | |
| hdd | 906920 | 60.77 | 32.88 | 54.83 | 14923.79 | 10339.98 | |
| rawdev | 6077534 | 60 | 4.11 | 53.1 | 101291.84 | 106232.02 | |
| readahead | 1640951 | 60.03 | 1.24 | 54.2 | 27333.66 | 29598.68 | |
| revio | 114781963 | 60.01 | 93.32 | 2294.07 | 1912803.22 | 48078.43 | |
| seek | 0 | 60.03 | 492.6 | 1899.07 | 0 | 0 | |
| sync-file | 533873 | 60 | 198.76 | 473.73 | 8897.78 | 793.88 | |
| BIOS (DAPC) | aio | 41134869 | 60 | 327.68 | 956.54 | 685563.61 | 32031.01 |
| aio | 13450.88 async I/O signals per sec (average per stressor) | ||||||
| aiol | 381309 | 60.08 | 97.43 | 139.59 | 6347.06 | 1608.76 | |
| hdd | 866740 | 60.61 | 96.75 | 131.69 | 14300.24 | 3794.17 | |
| rawdev | 6170726 | 60 | 10.73 | 149.95 | 102844.59 | 38403.82 | |
| readahead | 1730482 | 60.03 | 3.95 | 157.31 | 28827.11 | 10731.01 | |
| revio | 112259151 | 60.01 | 91.65 | 2295.59 | 1870778.57 | 47024.66 | |
| seek | 0 | 60.04 | 466.64 | 1924.64 | 0 | 0 | |
| sync-file | 308244 | 60 | 291.02 | 718.05 | 5137.27 | 305.47 |
The aio (asynchronous I/O) stressor in stress-ng creates asynchronous I/O operations to test the health of the system under a high I/O load. These operations include reading and writing files, sending and receiving network packets, and other actions that require I/O. In the test, the results for BIOS default performance significantly exceed BIOS (DAPC) for each of the test indicators.
The aiol, hdd, rawdev, readahead, revio, seek and sync-file stressors in stress-ng are designed to stress various system components and test their performance under high load conditions.
- The aiol stressor creates asynchronous I/O operations to check the health of the system under a high I/O load.
- The hdd stressor puts stress on the hard drive, for example by creating random file accesses or by reading and writing large amounts of data to the drive.
- The rawdev stressor places stress on I/O devices, such as block devices or virtual memory devices.
- The readahead stressor puts a load on the file reading subsystem, for example by reading large amounts of data from the file system.
- The revio stressor creates an I/O load using random file access and reading/writing files in reverse order.
- The seek stressor puts a load on the file read/write subsystem using random access to files and movement of the pointer within the file.
- The sync-file stressor creates a load on the file system by creating a large number of files and reading/writing them.
Conclusion
The conducted tests do not allow us to confirm the thesis of DELL platform manufacturers that there are significant energy savings when using the BIOS (DAPC) mode: system performance decreases when this mode is selected, and power consumption decreases slightly.
However, on some Dell servers, using DAPC BIOS mode may result in instability and system crashes. This is due to the fact that the BIOS DAPC mode cannot always correctly assess the load on the processor and correctly adjust its frequency and voltage to suit. As a result, the processor may operate at a low frequency, resulting in slower system performance.
Other power management technologies such as Intel SpeedStep or AMD PowerNow can be used in place of the DAPC BIOS, which can provide more stable system performance and optimize processor power consumption. Note that it is best to update the server BIOS to the latest version. This will avoid bugs and compatibility issues.
In general, the choice of energy management technology for a server depends on the specific server model and configuration, as well as the performance and energy efficiency requirements. The decision on the choice of technology should be made only after studying the manufacturer's recommendations and testing on a specific system.