
Author: Senior Devops. Lead Infrastructure Specialist Hostkey Nikita Zubarev
Hostkey provides servers for rent - this imposes on us, the employees of the company, the obligation to control the quality of the equipment. One of the key elements of maintaining a large infrastructure is an effective monitoring system that allows you to quickly identify server failures. We want to share our experience in implementing and using various tools to monitor the operation of equipment.
In this article, we will briefly review the options for installing Prometheus, Alertmanager and Node Exporter federation, and dwell on some of the features and settings. You can use the installation from the docker-compose file or deploy the system in a Kubernetes cluster. Our task is to collect metrics of the servers and services of the company's infrastructure, store them and respond to alerts. To solve these problems, a database is needed.
We chose Prometheus for a number of reasons:
- it is a popular tool with extensive documentation and a large community;
- open source code written in Golang;
- compatible with Docker etc.
Prometheus is a system and service monitoring system. It collects metrics from configured targets at specified time intervals, evaluates rule expressions, displays results, and can trigger alerts when certain conditions are met. We use ansible-playbook to install all system components.
One of the features of our company is a geo-distributed infrastructure: HOSTKEY has equipment in several data centers in Moscow, Amsterdam and New York. Hierarchical federation allows a Prometheus server to collect selected time series from another Prometheus server, as well as scale to environments with multiple data centers and nodes. In this case, the federation topology resembles a tree, where higher level Prometheus servers collect aggregated time series data from a larger number of downstream servers.
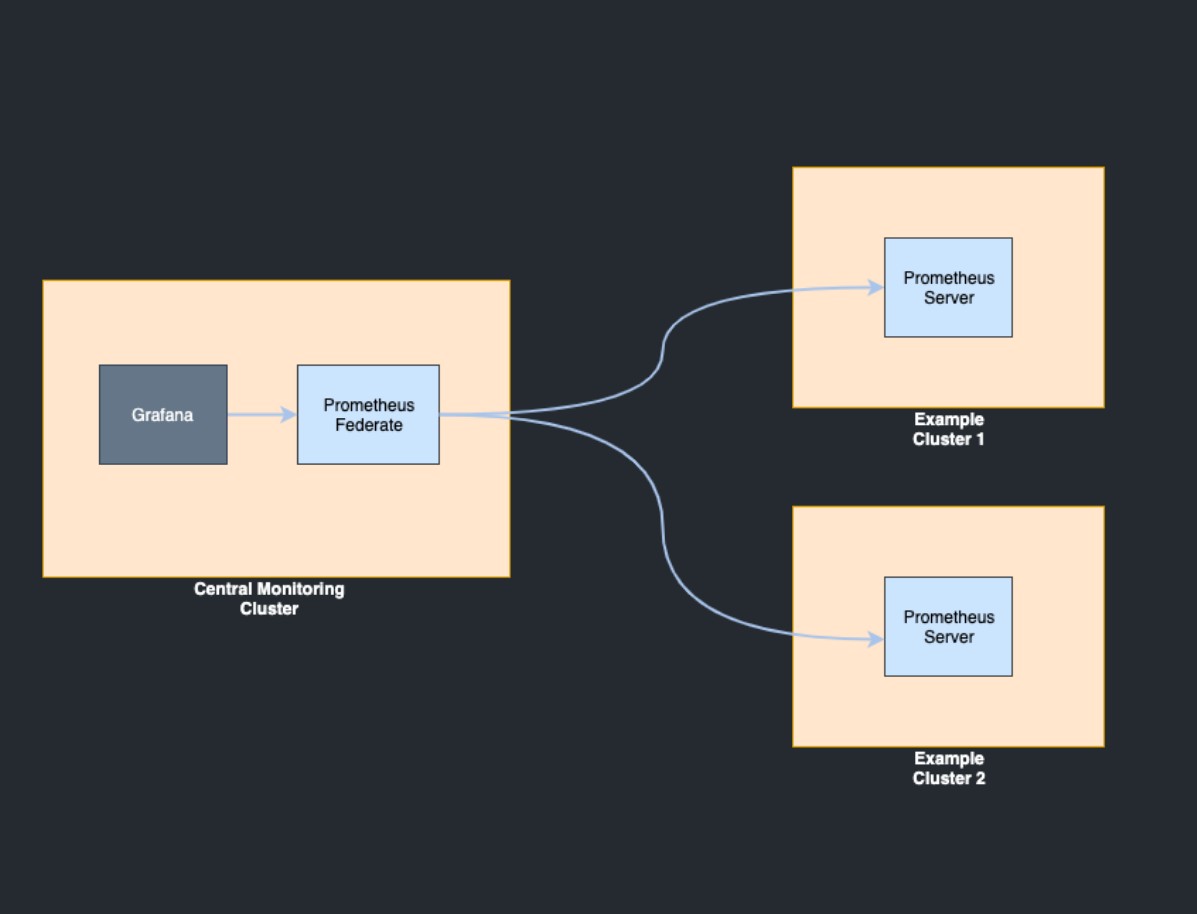
Configuration example from merging metrics from one server to another:
scrape_configs:
- job_name: 'federate'
	scrape_interval: 15s

	honor_labels: true
	metrics_path: '/federate'

	params:
		'match[]':
			- '{job="prometheus"}'
			- '{__name__=~"job:.*"}'

	static_configs:
		- targets:
			- 'ru-<instance_address>:9090'
			- 'nl-<instance_address>:9090'
			- 'us-<instance_address>:9090'
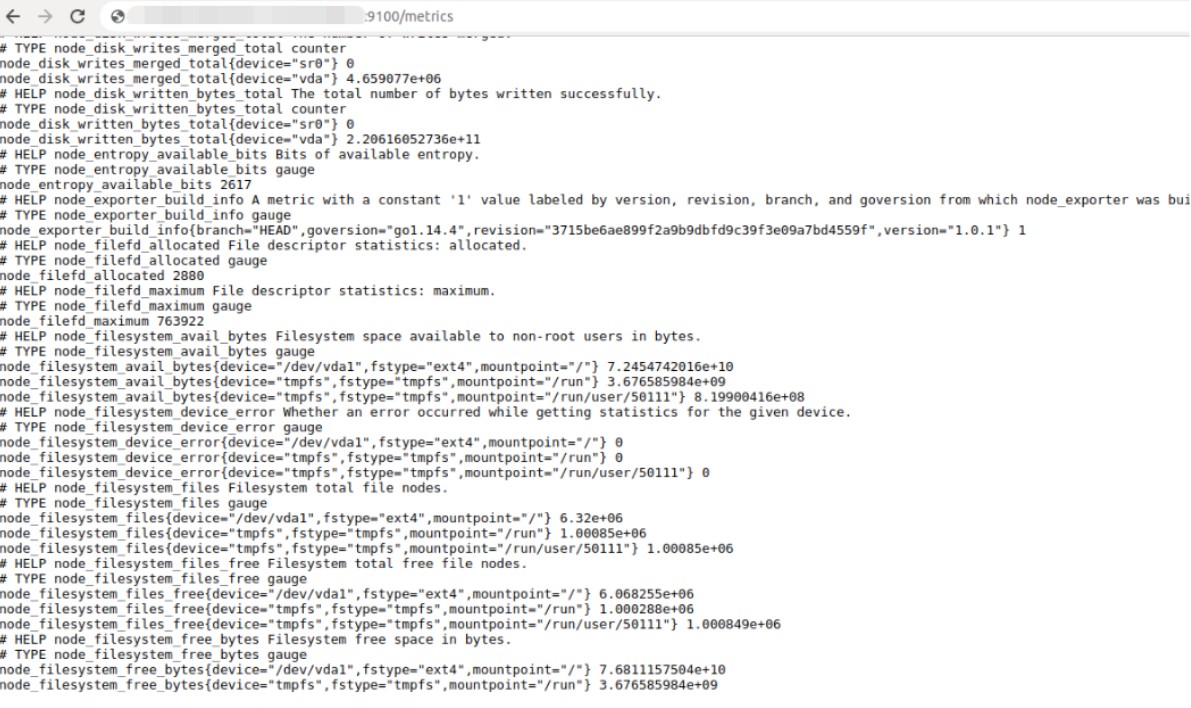
As a source of basic metrics for Prometheus, Node Exporter is used - an http application that collects operating system metrics.
Prometheus collects data from one or more instances of the Node Exporter (we will cover how to write your own exporter in the following articles). Node Exporter must be installed on every host.
After the launch, the metrics are available on port 9100:
In order for the metric to get into the Prometheus database, you need to describe the configuration in the file:
ru-federation-app01a / # vim /etc/prometheus/prometheus.yml
 - job_name: 'infra.hostkey'
	static_configs:
		- targets:
			- <instance_address>:9100
			- <instance_address>:9100
			- <instance_address>:9100
The file must be in .yaml format (we'll cover configuration management in future articles).
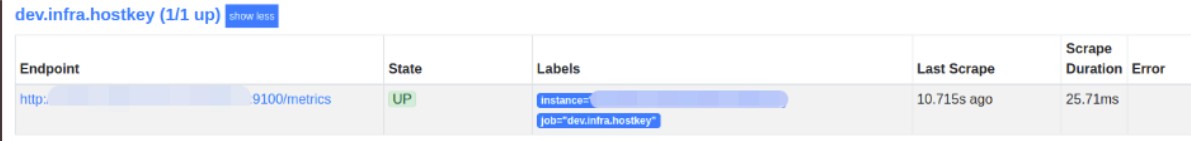
After restarting the Prometheus service, you can open its user interface in the browser "<server_address>:9090". The "/targets" page displays the status of the systems you are getting metrics from.
Visualization
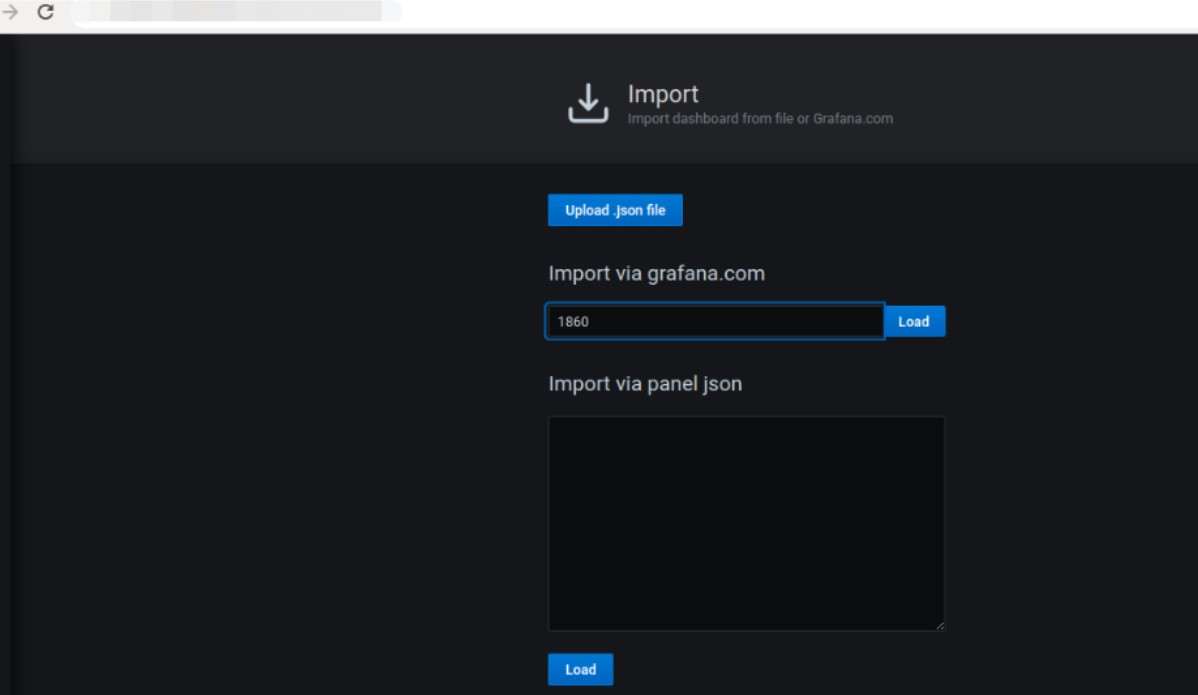
Grafana —is a frontend to various time series db: Graphite, InfluxDB, Prometheus — with beautiful and understandable graphs, and most importantly - with many templates suitable for 90% of possible tasks. The .json format makes it easy to customize charts. For convenience, we proxy the Grafana port through nginx and enable ldap authorization.
Almost all Node Exporter default values ??are presented as a graph. Import dashboard:
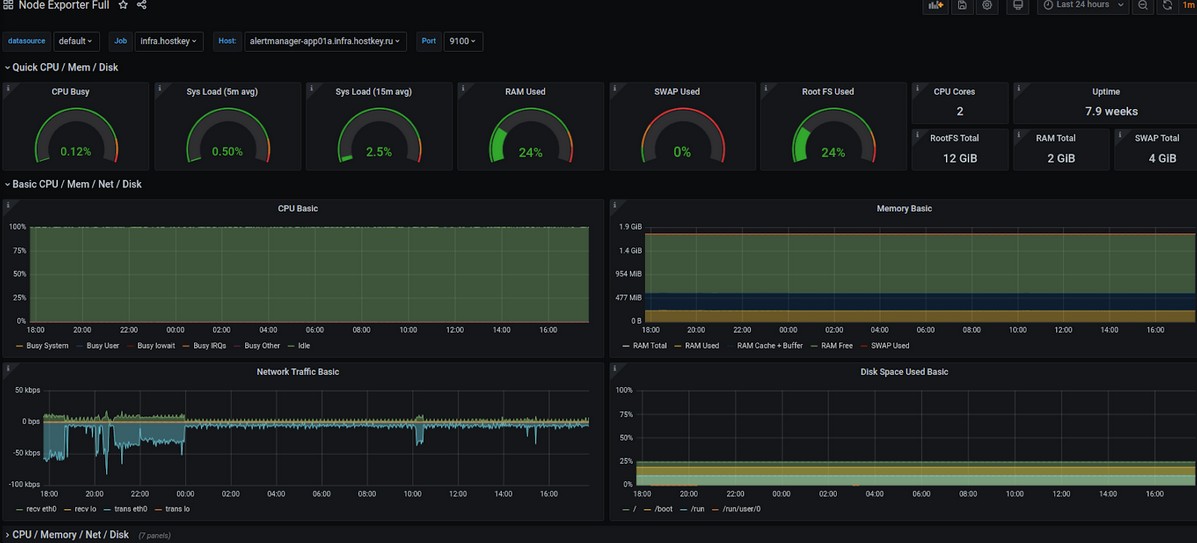
Alert display
Create an alert rule configuration <instance_address>.yml.
In fact, you can control the alerting of any parameter available in the node_exporter:
groups:
	- name: <instance_address>
		rules:
		- alert: InstanceDown
			expr: up{job="<instance_address>"} == 0
			for: 5m
			labels:
				severity: page
			annotations:
				summary: "Instance {{ .instance }} down"
				description: "{{ .instance }} of job {{ .job }} has been down for more than 5 minutes."

	#==========CPU==================================================================
		- alert: NodeCPUUsage
			expr: (100 - (irate(node_cpu{mode="idle", job="<instance_address>"}[5m]) * 100)) > 50
			for: 2m
			labels:
				severity: page
			annotations:
				summary: High CPU usage detected CPU usage is above 75%
	# ==============Memory==========================================================
		- alert: NodeSwapUsageSwap
			expr: (((node_memory_SwapTotal-node_memory_SwapFree{job="<instance_address>"})/node_memory_SwapTotal{job="<instance_address>"})*100) > 30
			for: 2m
			labels:
				severity: page
			annotations:
				summary: Swap usage detected Swap usage usage is above 50%
		- alert: NodeMemoryUsageMemFree
			expr: (((node_memory_MemTotal-node_memory_MemFree-node_memory_Cached{job="<instance_address>"})/(node_memory_MemTotal{job="<instance_address>"})*100)) > 30
			for: 2m
			labels:
				severity: page
			annotations:
				summary: High memory usage detected, Memory usage is above 50%
	#==============Load=============================================================

		- alert: nodeLoad1
			expr: node_load1{job="<instance_address>"} > 0.7
			for: 1m
			labels:
				severity: page
			annotations:
				summary: Load
	#================Disk space Used ================================================
		- alert: diskSpaceUsed
			expr: (100.0 - 100 * (node_filesystem_avail{job="<instance_address>"} / node_filesystem_size{job="<instance_address>"})) > 80
			for: 10m
			labels:
				severity: page
			annotations:
				summary: Disk space userd 80
	#=============nodeContrack========================================
		- alert: nodeContrack
			expr: node_nf_conntrack_entries{job="<instance_address>"} > 200
			for: 10m
			labels:
				severity: page
			annotations:
				summary: nodeContrack
	#=============nodeCntextSwitches ========================================
		- alert: nodeCntextSwitches
			expr: irate(node_context_switches{job="<instance_address>"}[5m]) > 100
			for: 5m
			labels:
				severity: page
			annotations:
				summary: nodeCntextSwitches
	#=============Disk Utilization per Device ========================================
		- alert: DiskUtilizationPerDevice
			expr: irate(node_disk_io_time_ms{job="<instance_address>"}[5m])/10 > 0.2
			for: 5m
			labels:
				severity: page
			annotations:
				summary: DiskUtilizationPerDevice
	#============Disk IOs per Device ========================================
		- alert: DiskIOsPerDeviceRead
			expr: irate(node_disk_reads_completed{job="<instance_address>"}[5m]) >10
			for: 5m
			labels:
				severity: page
			annotations:
				summary: DiskIOsPerDevice

		- alert: DiskIOsPerDeviceWrite
			expr: irate(node_disk_writes_completed{job="<instance_address>"}[5m]) > 10
			for: 5m
			labels:
				severity: page
			annotations:
				summary: DiskIOsPerDevice
	#===========Disk Throughput per Device========================================
		- alert: DiskThroughputPerDeviceReads
			expr: irate(node_disk_sectors_read{job="<instance_address>"}[5m]) * 512 >10000000
			for: 5m
			labels:
				severity: page
			annotations:
				summary: DiskIOsPerDevice
		- alert: DiskThroughputPerDeviceWrites
			expr: irate(node_disk_sectors_written{job="<instance_address>"}[5m]) * 512 > 10000000
			for: 5m
			labels:
				severity: page
			annotations:
				summary: DiskIOsPerDevice
	#===========Network Traffic========================================
		- alert: NetworkTrafficReceive
			expr: irate(node_network_receive_bytes{job="<instance_address>"}[5m])*8 > 5000
			for: 5m
			labels:
				severity: page
			annotations:
				summary: NetworkTrafficReceive
		- alert: NetworkTrafficTransmit
			expr: irate(node_network_transmit_bytes{job="<instance_address>"}[5m])*8 > 5000
			for: 5m
			labels:
				severity: page
			annotations:
				summary: NetworkTrafficTransmit

	#===========Netstat========================================
		- alert: Netstat
			expr: node_netstat_Tcp_CurrEstab{job="<instance_address>"} > 20
			for: 5m
			labels:
				severity: page
			annotations:
				summary: Netstat

	#===========UDP Stats============================
		- alert: UDPStatsInDatagrams
			expr: irate(node_netstat_Udp_InDatagrams{job="<instance_address>"}[5m]) > 50
			for: 5m
			labels:
				severity: page
			annotations:
				summary: UDPStats
		- alert: UDPStatsInErrors
			expr: irate(node_netstat_Udp_InErrors{job="<instance_address>"}[5m]) > 20
			for: 5m
			labels:
				severity: page
			annotations:
				summary: UDPStats
		- alert: UDPStatsOutDatagrams
			expr: irate(node_netstat_Udp_OutDatagrams{job="<instance_address>"}[5m]) > 50
			for: 5m
			labels:
				severity: page
			annotations:
				summary: UDPStats
		- alert: UDPStatsNoPorts
			expr: irate(node_netstat_Udp_NoPorts{job="<instance_address>"}[5m]) > 20
			for: 5m
			labels:
				severity: page
			annotations:
				summary: UDPStats
We connect the alert configuration in prometheus.yml:
rule_files:
- "<instance_address>.yml"
Alertmanager
Alerts can be redirected to almost any system: email, Telegram, Slack, Rocket.Chat.
alerting:
  alertmanagers:
  - static_configs:
    - targets:
      - alertmamager-app01a.infra.hostkey.ru:9093
Example for Rocket.Chat:
alertmanager-app01a ~ # vin /etc/alertmanager/alertmanager.yml

				route:
						repeat_interval: 5m
						group_interval: 5m
						receiver: 'rocketchat'

				receivers:
						- name: 'rocketchat'
							webhook_configs:
									- send_resolved: false
										url: 'https://chat_address/hooks/devtest'
Consider the main contents of the configuration file:
global:
	route:
		group_b: ['what rules to group the parameters by']
		group_wait: "delay before sending a notification for a group"
		group_interval: "time interval before sending second message for a group"
		repeat_interval: "time interval before sending repeated message"
		receive: "the name of the messaging method"
	receivers:
		- nam: "the name of the messaging method"
		configuration
All alerts received by the AlertManager must be grouped so as not to send information about the same events several times. The group_by directive specifies which fields to use during grouping. After creating a new alert group, the group_wait parameter is connected to the case. It specifies the time to wait before sending the first message. The parameter allows you to receive the entire set of group alerts in one message, rather than a separate message for each alert.
The group_interval parameter specifies how long to wait after sending the first message for a group before sending repeated messages from the same group. However, not only does it affect the interval between messages, there is also the repeat_interval parameter, which indicates after what period of time the same alert can be sent again.
We get:
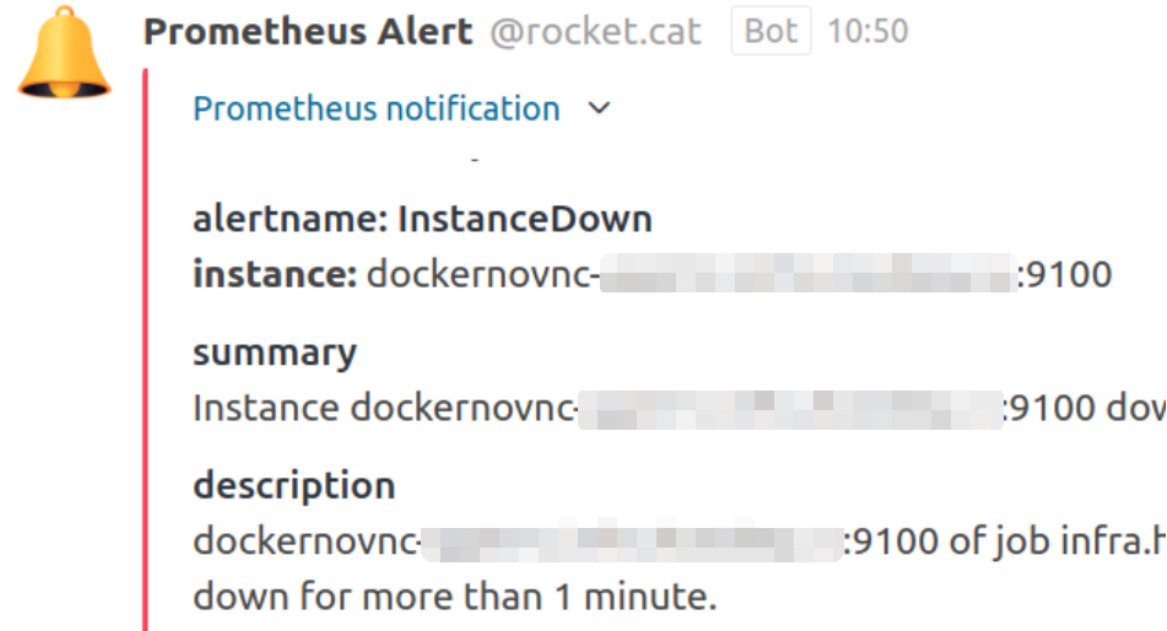
Prometheus AlertManager
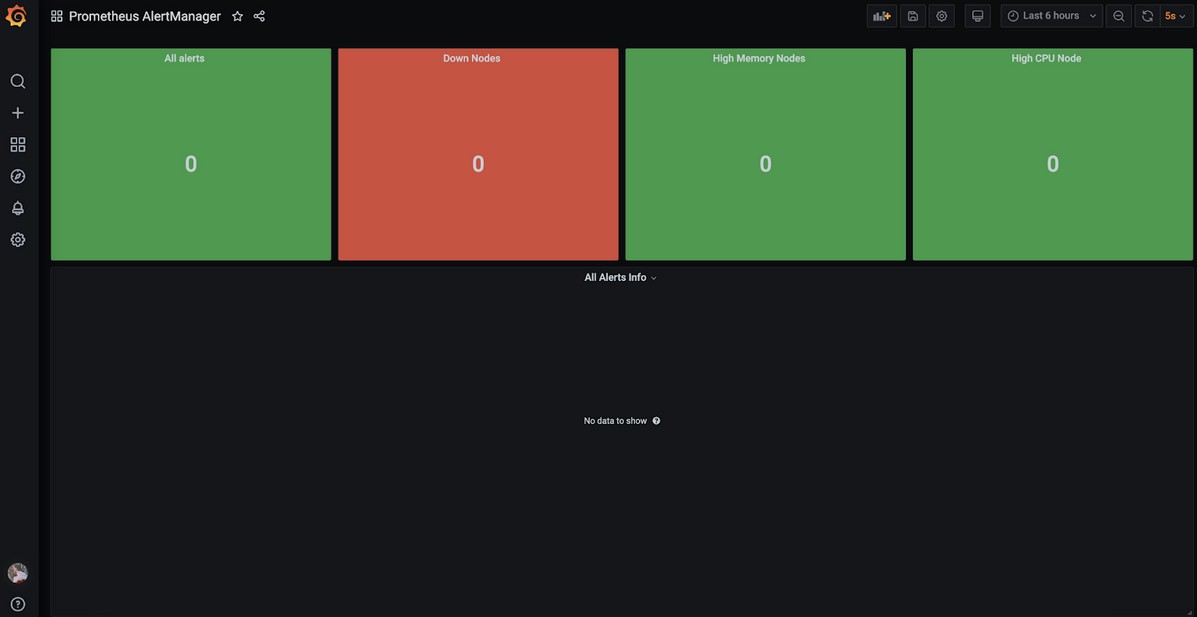
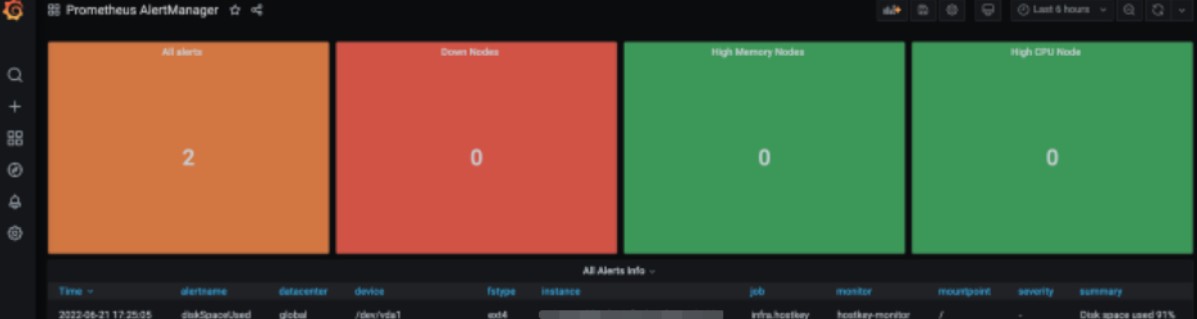
A visualization toolbar based on a single dashboard in our company is used to monitor the shift on duty:
As a result, we got a working monitoring system for a geo-distributed infrastructure, which we later adapted to our specifics (we will talk about this experience in future articles). The flexibility of the settings of the described services allows you to adapt the monitoring system to the specific needs of any company and significantly reduce the labor costs of engineers and other specialists to maintain the infrastructure.