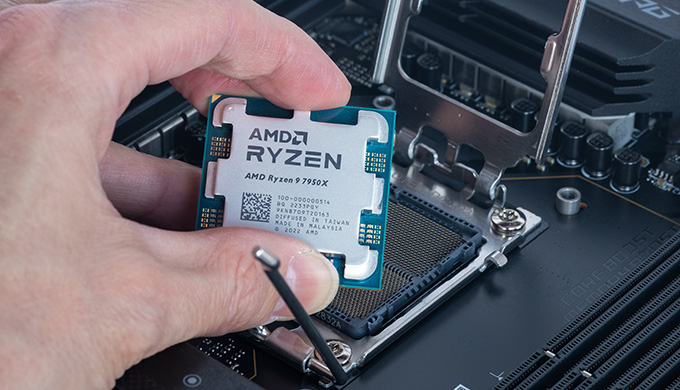
In this article we will compare AMD's new processor, the Ryzen 9 7950X, with the previous generation, the Ryzen 9 5950X from the same manufacturer and try to answer the question how advantageous it is to switch over to the new processor model for workloads.
Technical overview
AMD launched its Ryzen 7000 processor family in autumn of 2022. These CPUs are designed for both desktop and server applications and offer high performance and energy efficiency.
The key features of the new processors are as follows:
- Zen 4 Architecture: The Ryzen 7000 processors are built on the new Zen 4 architecture, offering higher performance and energy efficiency.
- AM5 Socket: The number of pins in the new socket has been significantly increased compared to the AM4 (1718 and 1331 pins respectively), achieving high data transfer speeds between processor and motherboard. In addition, the AM5 socket features a new mounting mechanism to improve CPU cooling and reduce noise (thanks to the use of new heat-conducting materials and a more precise positioning of the CPU on the motherboard).
- 5 nm Technology allows for high transistor density and performance gains.
- Cores and threads: Ryzen 7000 processors can have up to 16 cores and up to 32 threads giving high performance on a large number of simultaneous tasks.
- Hyper-Threading and Simultaneous Multithreading support: the ability to process multiple instruction threads simultaneously.
- PCIe 5.0 support: this enables high data transfer speeds between the processor and other devices.
- DDR5 Support.
- USB 4.0 Support.
- Improved cooling and power management: Ryzen 7000 processors feature improved cooling and power management, enabling stable performance under heavy loads.
- Virtualization support: Ryzen 7000 processors support virtualization, making them an ideal choice for server systems and virtual machines.
The Ryzen 7000 processors are a high-performance, energy-efficient solution for a wide range of workloads. AMD claims that the new processor line is significantly superior to its predecessor in terms of performance. Let's see if this is indeed the case. We will take the Ryzen 9 5950X and Ryzen 9 7950X for comparison.
Key Technical Characteristics
| Ryzen 9 7950X | Ryzen 9 5950X | |
| Release date | 27th September, 2022 | 20th October, 2020 |
| Socket | AM5 | AM4 |
| Core | Raphael (Zen 4) | Vermeer (Zen 3) |
| Chipsets | X670E, X670, B650E, B650 | X570, B550, A520, X470, B450 |
| Number of cores | 16 | 16 |
| Process technology (nm) | 5 | 7 |
| Number of transistors (billion) | 13.1 | 4.15 |
Frequency characteristics | ||
| Clock frequency (MHz) | 4500 | 3400 |
| Max frequency with Turbo Boost (MHz) | 5700 | 4900 |
| Multiplication factor | 45 | 34 |
| Maximum memory capacity (GB) | 128 | 128 |
| Memory Type | DDR5-5200 | DDR4-3200 |
| Maximum number of memory channels | 2 | 2 |
| Maximum memory bandwidth (GB/s) | 73.4 | 47.68 |
| ECC Support | yes | yes |
Cache | ||
| L1 cache capacity (Kb) | 1024 | 1024 |
| L2 cache capacity (Kb) | 16 | 8 |
| L3 cache capacity (Kb) | 64 | 64 |
Other | ||
| Typical heat dissipation (W) | 170 | 105 |
| Maximum operating temperature (°C) | 95 | 90 |
| PCI Express Version | 5.0 | 4.0 |
| Integrated graphics accelerator | Radeon Graphics (Ryzen 7000) | — |
| Price (USD) | 550 | 450 |
The key differences between the Ryzen 9 7950X and the Ryzen 9 5950X are:
- A new architecture.
- Almost three times more transistors.
- 54 per cent more maximum memory bandwidth.
- State-of-the-art 5 nm process technology.
- The new PCI Express standard - 5.0
- 16% higher Turbo Boost speeds (5.7GHz vs. 4.9GHz)
- Availability of an integrated Radeon Graphics accelerator in the Ryzen 7000.
Comparing processors by their specifications can give a general idea of a processor's capabilities. However, to get a more accurate estimate of a processor’s performance, it is better to test it on specific tasks.
Description of the test environment
| 5950X | 7950X | |
| CPU | AMD Ryzen 9 5950X 3.4GHz (16 cores) | AMD Ryzen 9 7950X 4.5GHz (16 core) |
| RAM | 2x16 Gb DDR4 SO-DIMM | 4x32 GB DDR5 |
| Graphics Card | AMD Radeon Graphics | |
| SSD | 1x240Gb NVMe SSD | 1x512Gb NVMe SSD |
| Motherboard | ASRock X570D4I-2T | Gigabyte X670 GAMING X A |
| Operating System | Microsoft Windows 10 | Microsoft Windows 10 |
Tests
stress-ng —-cpu 32 —-io 4 —-vm 1 —-vm-bytes 32G —-timeout 60s —-metrics-brief| stressor | bogo ops (secs) | real time (secs) | usr time (secs) | sys time (secs) | bogo ops/s (real time) | bogo ops/s (usr+sys time) | |
| AMD Ryzen 9 5950X | cpu | 2509636 | 60.01 | 1754.82 | 0.55 | 41823.2 | 1429.69 |
| io | 14076 | 60.03 | 0.05 | 0.94 | 234.49 | 14196.47 | |
| vm | 5748301 | 61.58 | 109.74 | 42.2 | 93352.83 | 37833.13 |
stress-ng —-cpu 32 —-io 8 —-vm 4 —-vm-bytes 128G —-timeout 60s —-metrics-brief| stressor | bogo ops (secs) | real time (secs) | usr time (secs) | sys time (secs) | bogo ops/s (real time) | bogo ops/s (usr+sys time) | |
| AMD Ryzen 9 7950X | cpu | 3240575 | 60 | 1673.25 | 7.21 | 54008.35 | 1928.39 |
| io | 595084 | 60 | 1.05 | 15.93 | 9917.64 | 35034.97 | |
| vm | 337066 | 62.65 | 87.94 | 115.35 | 5379.81 | 1657.99 |
Drives
stress-ng —-sequential 0 —-class io —-timeout 60s —-metrics-brief| stressor | bogo ops | real time (secs) | usr time (secs) | sys time (secs) | bogo ops/s (real time) | bogo ops/s (usr+sys time) | ||
7950X | aio | 4216227 | 60.11 | 3.44 | 18.67 | 70144.56 | 190678.74 | |
| aio | 1248.68 async I/O signals per sec (average per stressor) | |||||||
| aiol | 614553 | 60.11 | 14.33 | 43.39 | 10224.4 | 10646.98 | ||
| hdd | 4275200 | 60.14 | 96.84 | 128.57 | 71093.06 | 18966.11 | ||
| io-uring | 532848 | 60.02 | 0.22 | 44.95 | 8877.12 | 11795.58 | ||
| rawdev | 20866453 | 60 | 2.05 | 36.19 | 347771.34 | 545582.5 | ||
| readahead | 2608140 | 60.01 | 0.44 | 39.55 | 43459.6 | 65209.08 | ||
| revio | 267332942 | 60.1 | 49.22 | 1846.64 | 4448303.11 | 141008.43 | ||
| seek | 0 | 60.01 | 111.47 | 1807.18 | 0 | 0 | ||
| sync-file | 95264 | 60 | 9.38 | 37.52 | 1587.62 | 2031.12 | ||
5950X | aio | 1888993 | 60.03 | 1.86 | 12.27 | 31468.87 | 133655.35 | |
| aio | 631.01 async I/O signals per sec (average per stressor) | |||||||
| aiol | 744673 | 60.12 | 30.38 | 64.97 | 12385.6 | 7810.11 | ||
| hdd | 985088 | 60.9 | 25.8 | 38.92 | 16175.11 | 15222.32 | ||
| io-uring | 130168 | 60.02 | 0.27 | 16.03 | 2168.81 | 7985.01 | ||
| rawdev | 18115648 | 60 | 2.12 | 60.45 | 301926.12 | 289528.49 | ||
| readahead | 4562553 | 60.01 | 1.55 | 29.12 | 76035.53 | 148741.54 | ||
| revio | 219069788 | 60.02 | 37.27 | 1872.58 | 3650238.34 | 114705.27 | ||
| seek | 0 | 60.01 | 222.08 | 1695.37 | 0 | 0 | ||
| sync-file | 113792 | 60 | 8.81 | 43.38 | 1896.46 | 2180.3 | ||
A detailed description of stressors can be found in our previous article.
- V-Ray Benchmark

Ryzen 9 7950X outperforms its predecessor by 30%.
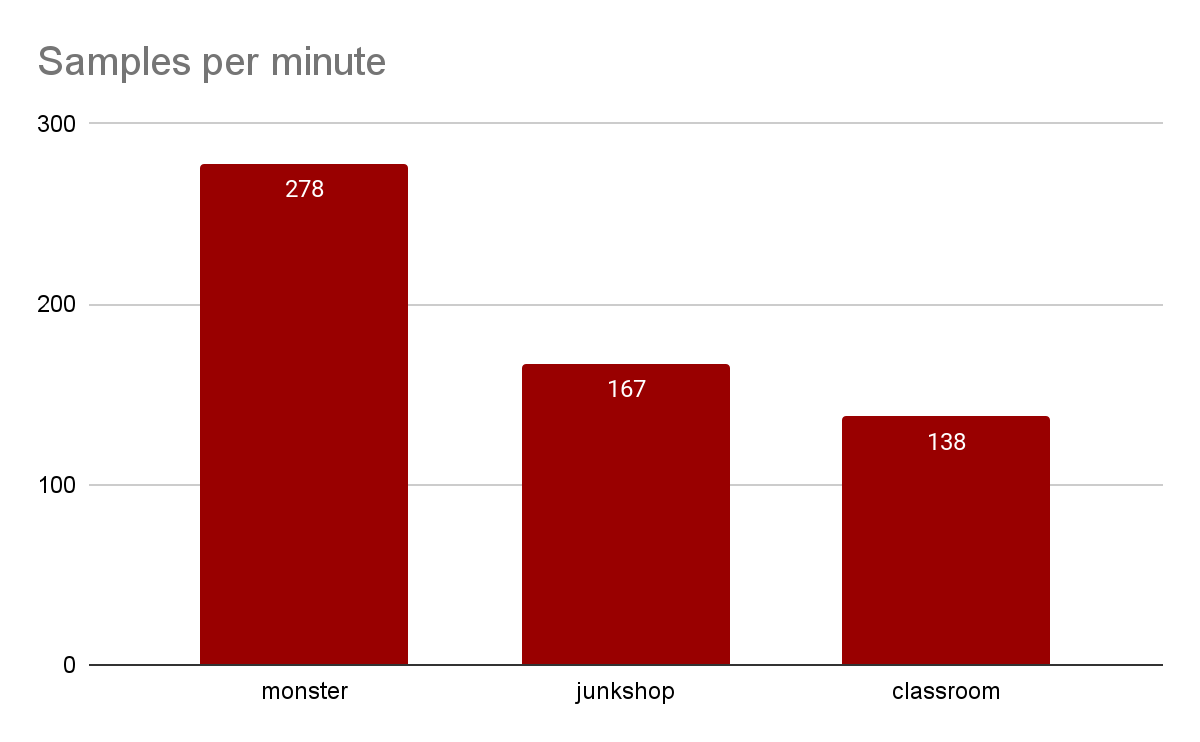
- Blender
Ryzen 9 7950X
Overall performance
- JetStream 2.0, measuring code performance in JavaScript and WebAssembly.
JetStream 2.0 is a benchmark that tests JavaScript performance in the browser. It is used to evaluate the performance of the processors used in personal computers and mobile devices.
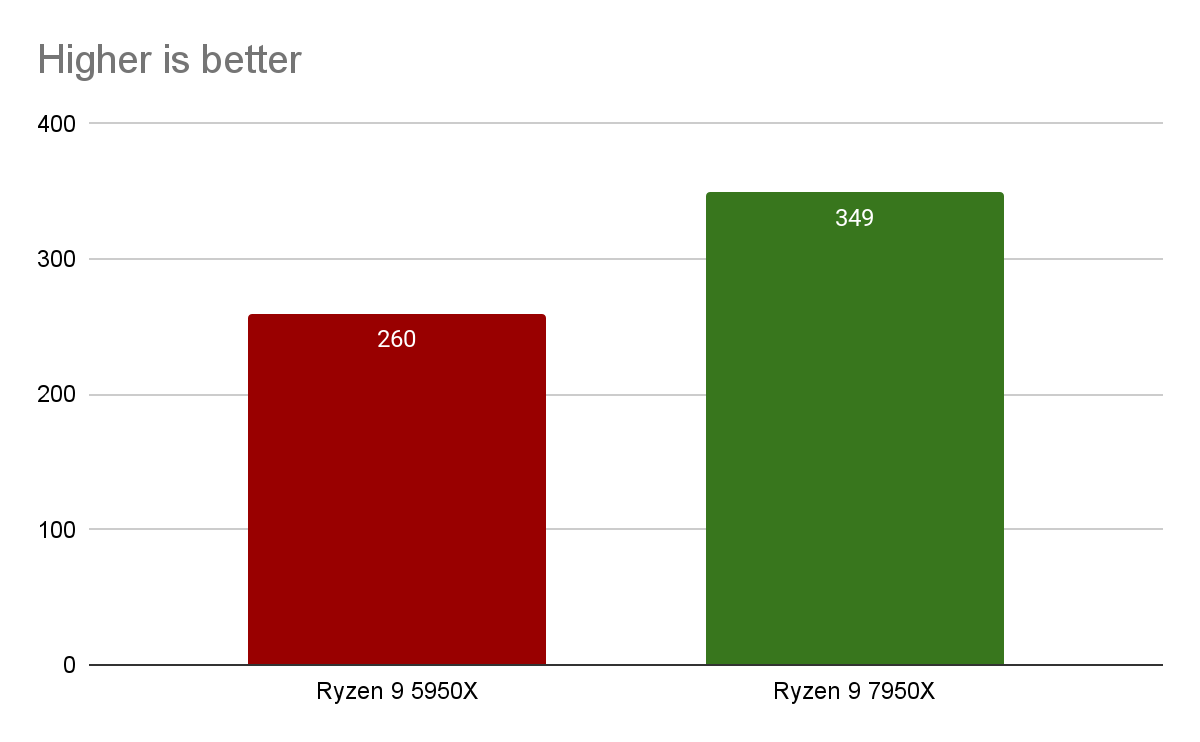
The Ryzen 9 7950X results are 34% better than the Ryzen 9 5950X. AMD's new processor offers higher clock speeds, more cores, a more efficient architecture and other features that allow it to perform tasks faster and more efficiently.
Working with video
The video file bbb_sunflower_1080p_30fps_normal.mp4 (from the Blender demo repository) and the video transcoding test - SVT-AV1 Handbrake - were used for the tests.
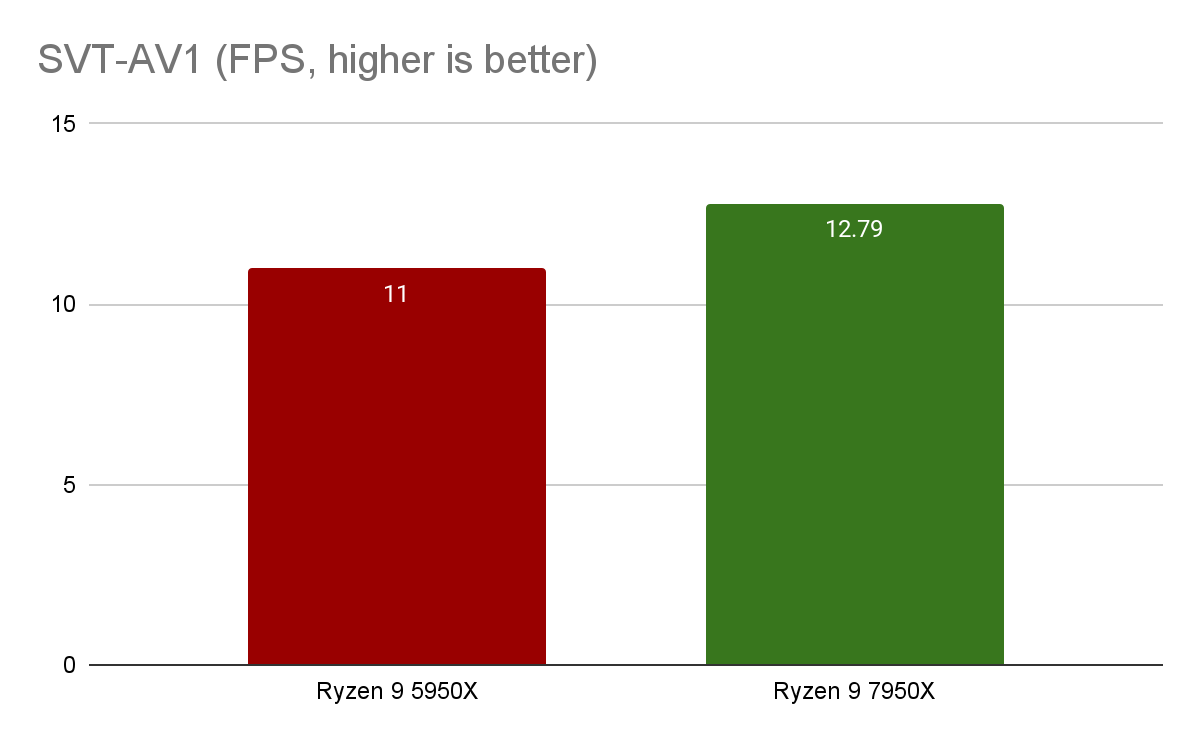
The Ryzen 9 7950X result is slightly (16%) higher than the Ryzen 9 5950X. The result of this test may be affected not only by the technical characteristics of the processors themselves, but also by other factors, such as an incorrectly compiled project.
- Cinebench

The Cinebench Multi Core test measures processor performance on tasks that use multiple processor cores simultaneously. The Ryzen 9 7950X outperforms its predecessor by 79.71%, indicating high multi-threaded performance.

The Cinebench Single Core Test measures a processor's performance when performing tasks using only one processor core. In this test, AMD's new processor performs 29% better than the Ryzen 9 5950X.
The MP ratio (multi-threaded ratio) is the ratio of the Multi Core and Single Core test results. An MP ratio close to 1 means that the processor's performance in multi-threaded tasks and single core tasks is roughly equal. If the MP ratio is greater than 1, it means the processor performs better at multitasking than it does at single core tasks. The Ryzen 9 7950X outperforms its predecessor by 39%.
Cryptographic tests
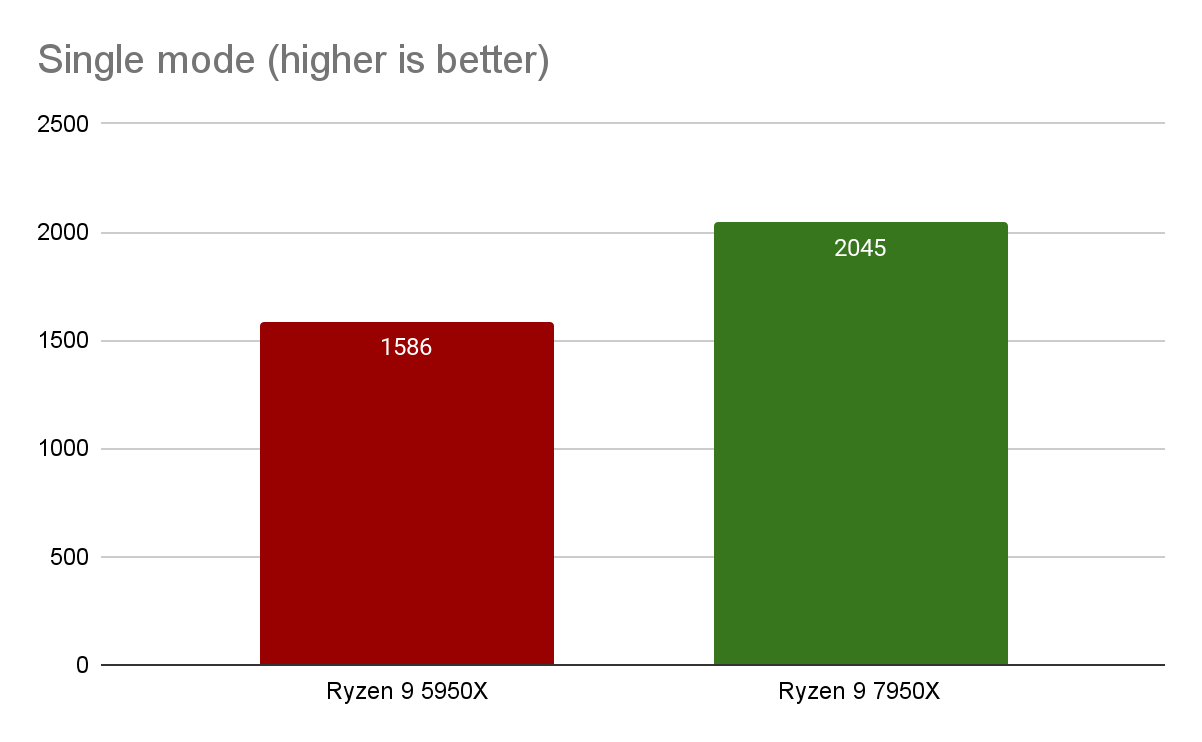
- John The Ripper

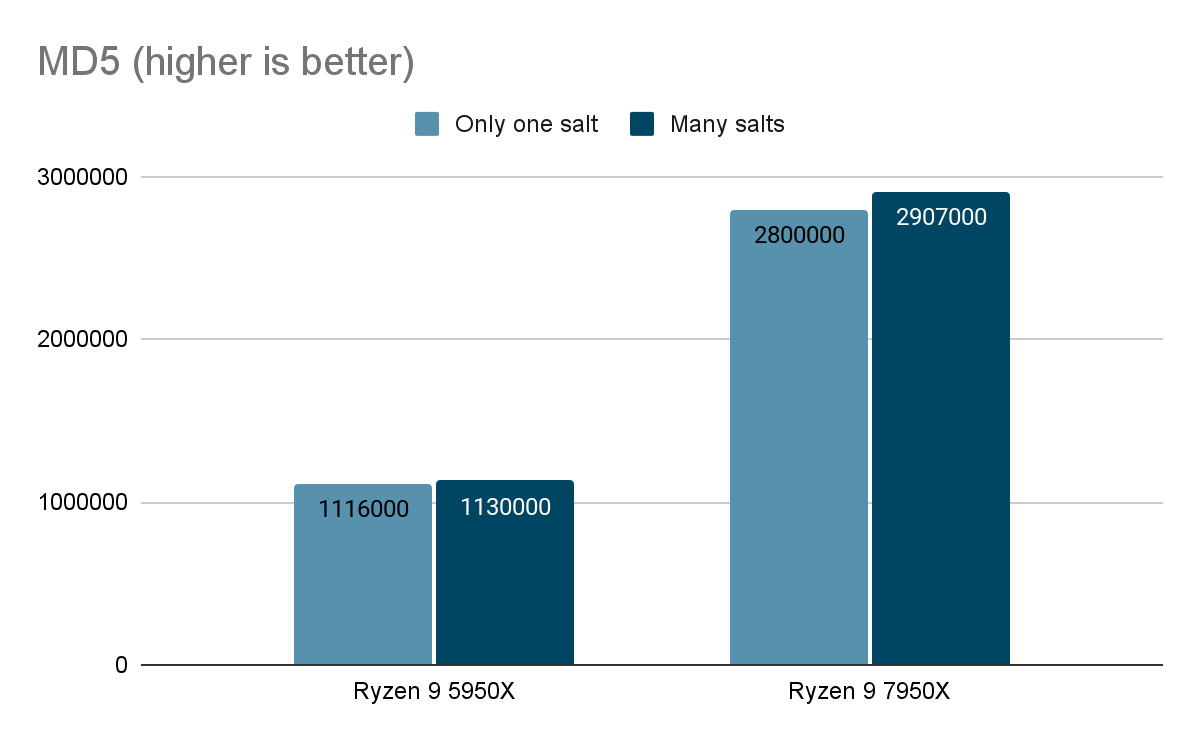
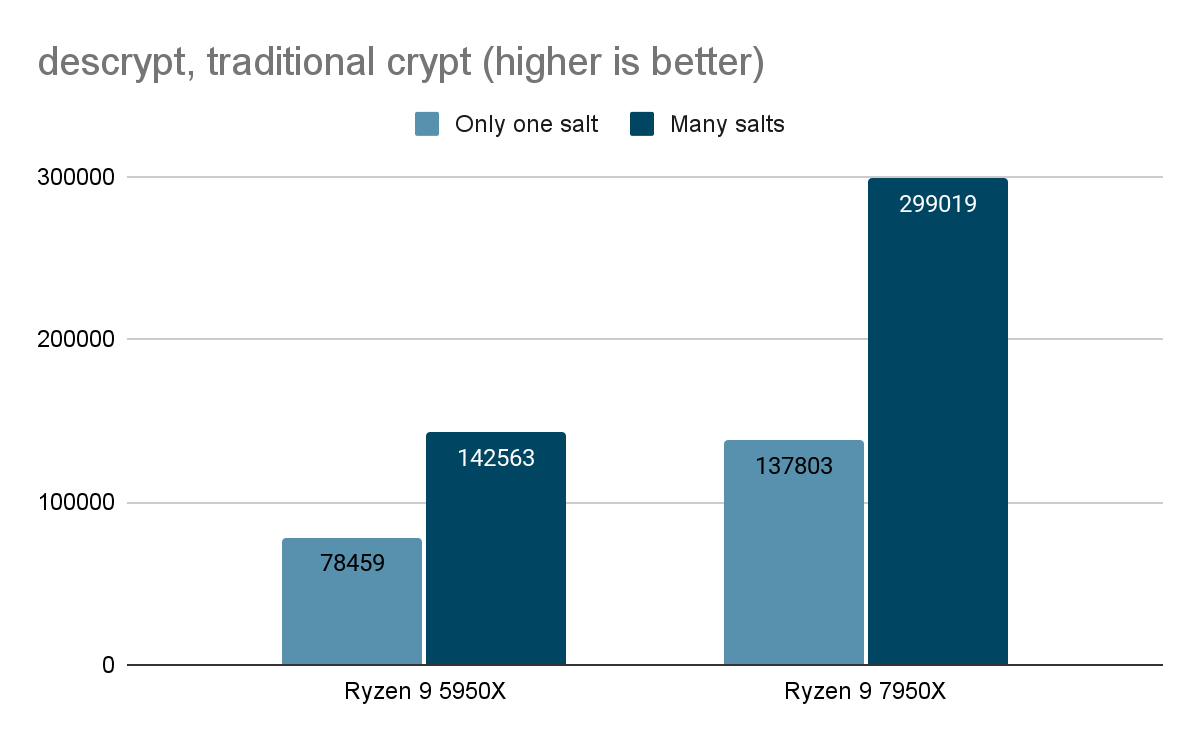
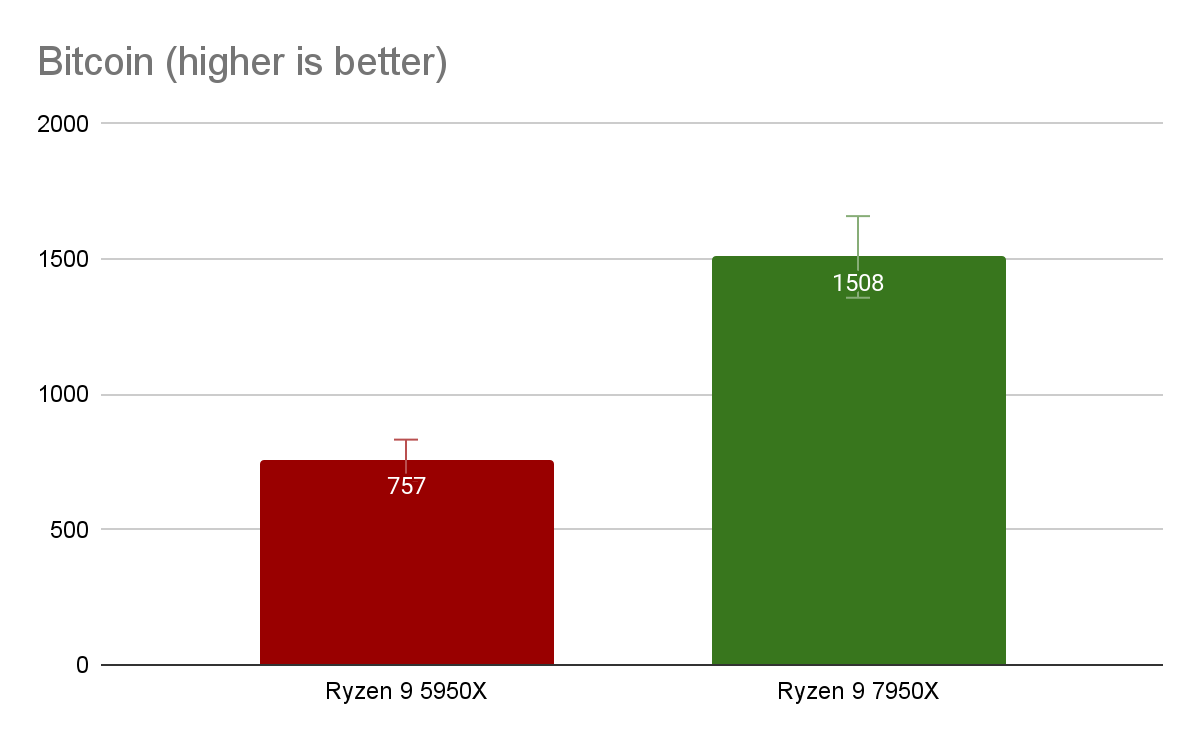
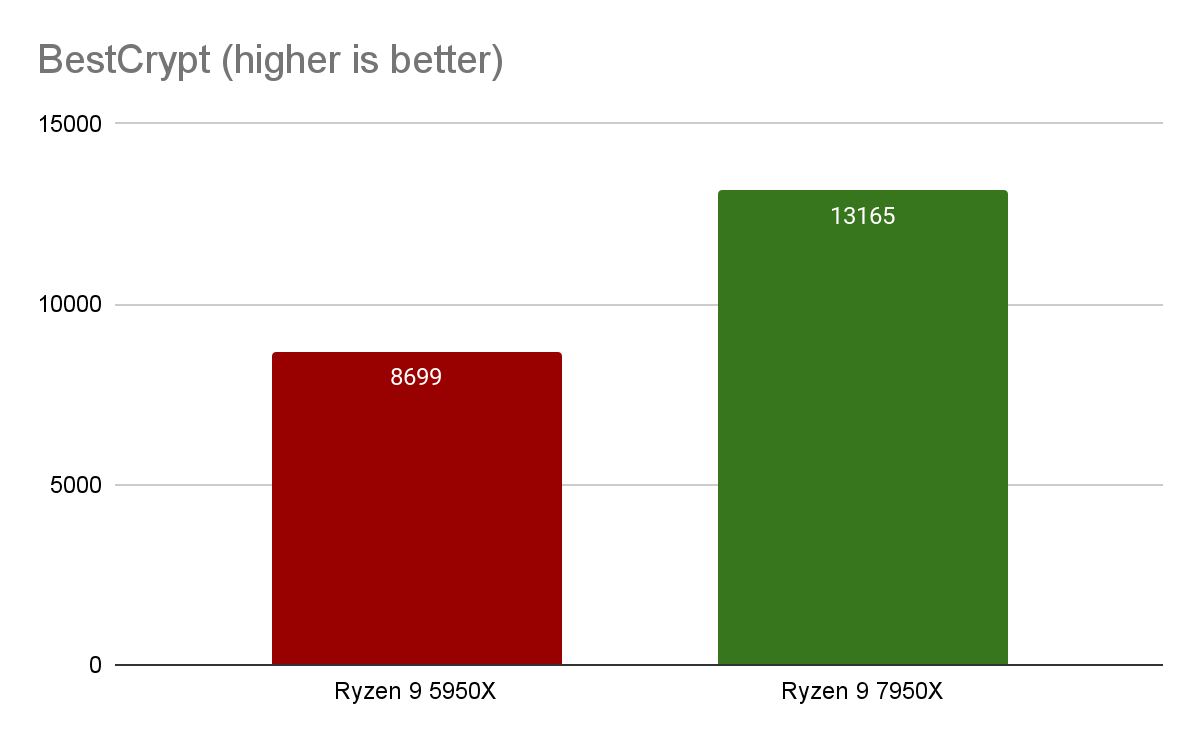
The John the Ripper Test for various password encryption algorithms, including Blowfish, MD5, descrypt (traditional crypt), BestCrypt and Bitcoin, provides information about the CPU's performance with encrypted data. The Ryzen 9 7950X results demonstrate a high performance (nearly double that of its predecessor) when dealing with encrypted data.
Machine Learning
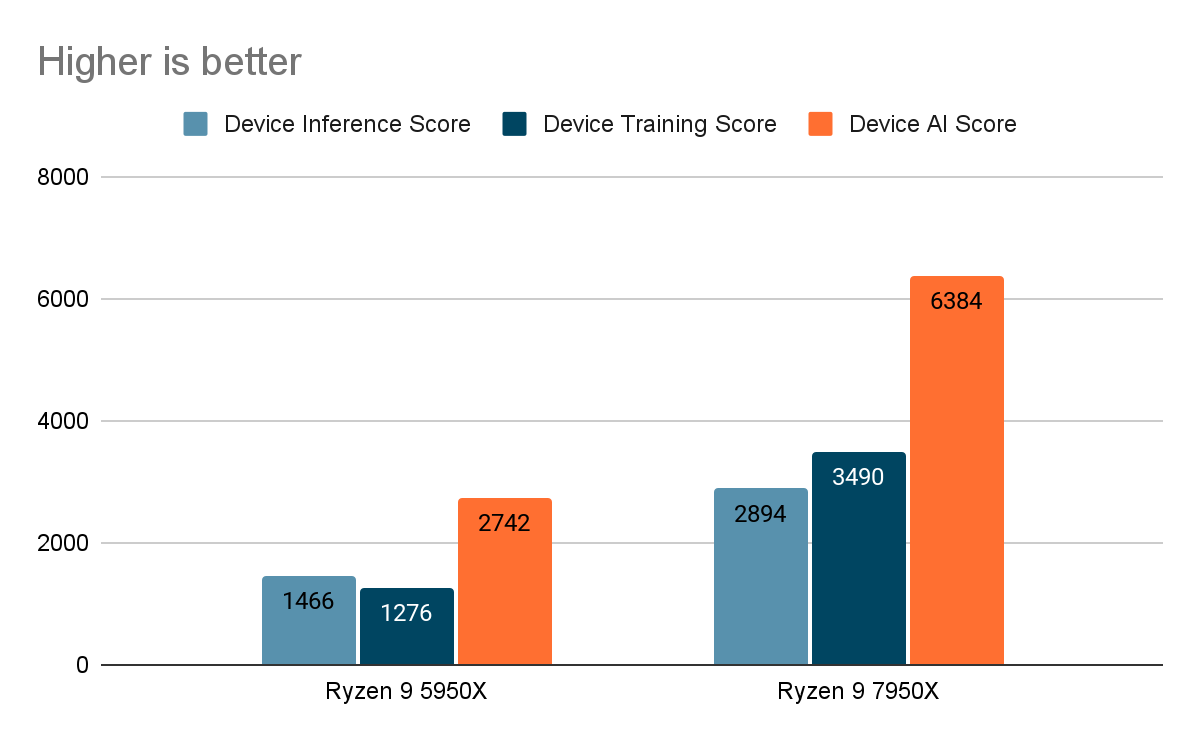
- AI-Benchmark
AI-Benchmark allows you to measure the performance of your device during an AI model output task. The unit of measurement can vary according to the test, but is usually the number of operations per second (OPS) or the number of images per second (FPS).
More detailed test results are shown in the table below:
| Ryzen 9 5950X | Ryzen 9 7950X | |
| 1/19. MobileNet-V2 | 1.1 — inference | batch=50, size=224x224: 207 ± 6 ms1.2 — training | batch=50, size=224x224: 1102 ± 13 ms | 1.1 — inference | batch=50, size=224x224: 139 ± 3 ms1.2 — training | batch=50, size=224x224: 610 ± 1 ms |
| 2/19. Inception-V3 | 2.1 — inference | batch=20, size=346x346: 453 ± 32 ms2.2 — training | batch=20, size=346x346: 2461 ± 68 ms | 2.1 — inference | batch=20, size=346x346: 187 ± 3 ms2.2 — training | batch=20, size=346x346: 796 ± 4 ms |
| 3/19. Inception-V4 | 3.1 — inference | batch=10, size=346x346: 443 ± 25 ms3.2 — training | batch=10, size=346x346: 2224 ± 33 ms | 3.1 — inference | batch=10, size=346x346: 181 ± 2 ms3.2 — training | batch=10, size=346x346: 803 ± 3 ms |
| 4/19. Inception-ResNet-V2 | 4.1 — inference | batch=10, size=346x346: 385 ± 14 ms4.2 — training | batch=8, size=346x346: 1984 ± 32 ms | 4.1 — inference | batch=10, size=346x346: 239 ± 2 ms4.2 — training | batch=8, size=346x346: 793 ± 2 ms |
| 5/19. ResNet-V2-50 | 5.1 — inference | batch=10, size=346x346: 274 ± 5 ms5.2 — training | batch=10, size=346x346: 1649 ± 41 ms | 5.1 — inference | batch=10, size=346x346: 137.5 ± 0.7 ms5.2 — training | batch=10, size=346x346: 549 ± 2 ms |
| 6/19. ResNet-V2-152 | 6.1 — inference | batch=10, size=256x256: 355 ± 4 ms6.2 — training | batch=10, size=256x256: 2351 ± 49 ms | 6.1 — inference | batch=10, size=256x256: 193 ± 2 ms6.2 — training | batch=10, size=256x256: 783 ± 2 ms |
| 7/19. VGG-16 | 7.1 — inference | batch=20, size=224x224: 554 ± 6 ms7.2 — training | batch=2, size=224x224: 1367 ± 13 ms | 7.1 — inference | batch=20, size=224x224: 389 ± 3 ms7.2 — training | batch=2, size=224x224: 459 ± 3 ms |
| 8/19. SRCNN 9-5-5 | 8.1 — inference | batch=10, size=512x512: 592 ± 21 ms8.2 — inference | batch=1, size=1536x1536: 537 ± 17 ms8.3 — training | batch=10, size=512x512: 7718 ± 23 ms | 8.1 — inference | batch=10, size=512x512: 185 ± 2 ms8.2 — inference | batch=1, size=1536x1536: 172 ± 2 ms8.3 — training | batch=10, size=512x512: 745 ± 8 ms |
| 9/19. VGG-19 Super-Res | 9.1 — inference | batch=10, size=256x256: 891 ± 56 ms9.2 — inference | batch=1, size=1024x1024: 1584 ± 56 ms9.3 — training | batch=10, size=224x224: 7176 ± 20 ms | 9.1 — inference | batch=10, size=256x256: 383 ± 1 ms9.2 — inference | batch=1, size=1024x1024: 627 ± 5 ms9.3 — training | batch=10, size=224x224: 1300 ± 14 ms |
| 10/19. ResNet-SRGAN | 10.1 — inference | batch=10, size=512x512: 1154 ± 25 ms10.2 — inference | batch=1, size=1536x1536: 1043 ± 18 ms10.3 — training | batch=5, size=512x512: 3300 ± 93 ms | 10.1 — inference | batch=10, size=512x512: 645 ± 4 ms10.2 — inference | batch=1, size=1536x1536: 559 ± 4 ms10.3 — training | batch=5, size=512x512: 922 ± 6 ms |
| 11/19. ResNet-DPED | 11.1 — inference | batch=10, size=256x256: 1484 ± 13 ms11.2 — inference | batch=1, size=1024x1024: 2416 ± 20 ms11.3 — training | batch=15, size=128x128: 4218 ± 77 ms | 11.1 — inference | batch=10, size=256x256: 839 ± 2 ms11.2 — inference | batch=1, size=1024x1024: 1343 ± 8 ms11.3 — training | batch=15, size=128x128: 1197 ± 7 ms |
| 12/19. U-Net | 12.1 — inference | batch=4, size=512x512: 2830 ± 36 ms12.2 — inference | batch=1, size=1024x1024: 2939 ± 29 ms12.3 — training | batch=4, size=256x256: 3231 ± 33 ms | 12.1 — inference | batch=4, size=512x512: 1664 ± 10 ms12.2 — inference | batch=1, size=1024x1024: 1686 ± 10 ms12.3 — training | batch=4, size=256x256: 1388 ± 5 ms |
| 13/19. Nvidia-SPADE | 13.1 — inference | batch=5, size=128x128: 975 ± 18 ms13.2 — training | batch=1, size=128x128: 1227 ± 13 ms | 13.1 — inference | batch=5, size=128x128: 469 ± 5 ms13.2 — training | batch=1, size=128x128: 610 ± 5 ms |
| 14/19. ICNet | 14.1 — inference | batch=5, size=1024x1536: 1055 ± 40 ms14.2 — training | batch=10, size=1024x1536: 2632 ± 61 ms | 14.1 — inference | batch=5, size=1024x1536: 500 ± 8 ms14.2 — training | batch=10, size=1024x1536: 1109 ± 12 ms |
| 15/19. PSPNet | 15.1 — inference | batch=5, size=720x720: 4494 ± 118 ms15.2 — training | batch=1, size=512x512: 1978 ± 61 ms | 15.1 — inference | batch=5, size=720x720: 2948 ± 19 ms15.2 — training | batch=1, size=512x512: 895 ± 15 ms |
| 16/19. DeepLab | 16.1 — inference | batch=2, size=512x512: 1633 ± 40 ms16.2 — training | batch=1, size=384x384: 1556 ± 69 ms | 16.1 — inference | batch=2, size=512x512: 561 ± 2 ms16.2 — training | batch=1, size=384x384: 602 ± 2 ms |
| 17/19. Pixel-RNN | 17.1 — inference | batch=50, size=64x64: 1296 ± 3 ms17.2 — training | batch=10, size=64x64: 667 ± 4 ms | 17.1 — inference | batch=50, size=64x64: 1003 ± 6 ms17.2 — training | batch=10, size=64x64: 659 ± 9 ms |
| 18/19. LSTM-Sentiment | 18.1 — inference | batch=100, size=1024x300: 2526 ± 12 ms18.2 — training | batch=10, size=1024x300: 3867 ± 5 ms | 18.1 — inference | batch=100, size=1024x300: 1144 ± 22 ms18.2 — training | batch=10, size=1024x300: 2544 ± 9 ms |
| 19/19. GNMT-Translation | 19.1 — inference | batch=1, size=1x20: 1076 ± 20 ms | 19.1 — inference | batch=1, size=1x20: 669 ± 3 ms |
Conclusions
The tests we've conducted indicate that both processors are powerful and high-performing solutions for both PCs and servers. When comparing the Ryzen 9 5950X and Ryzen 9 7950X, we can conclude that the latter is more efficient in certain tasks such as scientific computing or video rendering. At the same time, the new processor is 22% more expensive than the Ryzen 9 5950X.
The Ryzen 9 7950X surpasses the Ryzen 9 5950X thanks to a number of technical improvements. First and foremost, this is due to a change in the processor architecture and the new AM5 socket. The Ryzen 9 7950X features the more advanced Zen 4 architecture, which optimizes many key processor parameters, including core frequency and power consumption.
Another advantage of the Ryzen 9 7950X is supporting the latest PCIe 5.0 standard, which provides faster data transfer speeds between the processor and other system components. It also has more PCIe lanes, allowing more devices to be used simultaneously at a high performance.
Finally, the Ryzen 9 7950X supports faster and more efficient DDR5 RAM. This also significantly improves overall system performance and ensures lower latency when reading and writing data.