
The authors:
DevOps. Hostkey Microsoft Technology Specialist: Fedor Potapov
Senior DevOps.Hostkey Lead Infrastructure Specialist: Nikita Zubarev
Earlier this year, Hostkey needed to closely monitor key files and their change history on our servers. We sought a solution that would guarantee a stable file configuration on our servers and reliable alerts in event that these files changed.
We looked at several services that provide file monitoring and eventually settled on Wazuh. There are several reasons for this:
1. High client quality. The client part of Wazuh turned out to be the least resource-intensive, but at the same time stable and reliable. The mechanism for detecting, viewing, and comparing open source security compliance is important, but as secondary software. Accordingly, it should not place undue load on the server. If 50% of the server’s resources go to monitoring, then something is not working right.
2. Development and client support. It runs on multiple platforms, including Windows and Linux.
3. The final interface is built on Open Distro. Our infrastructure has already used an Open Distro logger (over time, we switched to OpenSearch). Nevertheless, this solution was both interesting and comfortable from the perspective of minimizing support, since it uses a platform with which we are well acquainted.
Initially, we were looking for a solution for the Linux OSes, but Wazuh turned out to be a universal solution. The Windows administrator experience will be described below. We will talk about the specifics of using Wazuh on the Linux operating systems in a separate article.
Wazuh is a complete SIEM (Security Information and Event Management) system that works well with platforms. Wazuh allows you to scan running processes, check for CVE vulnerabilities, receive incident reports, etc. In this article, we will talk about the Windows administrator service, including our experience with connecting it to monitoring Windows hosts.
Wazuh allows for the implementation of a flexible policy management for groups. The following script is executed on the hosts:
if (!(Get-Service "WazuhSvc" —ErrorAction SilentlyContinue))
{
\\example.ru\SYSVOL\example.ru\scripts\wazuh-agent-4.2.6.msi /q WAZUH_MANAGER='wazuh.example.ru' WAZUH_REGISTRATION_SERVER='wazuh.example.ru' WAZUH_AGENT_GROUP='Windows_Workstations'
}
Avoiding the constant download of the Wazuh agent from the Internet is quite simple - you just need to set it up on a domain controller. After that, all hosts will receive the script automatically. You can download the script here.
There are policy sets for Wazuh. The Wazuh rule set is used to detect attacks, intrusions, software misuse, configuration issues, application errors, malware, rootkits, system anomalies, or security policy violations.
The rule set includes compliance mapping with PCI DSS v3.1 and CIS.
The monitoring mechanism is simple. Folders are created in var/ossec/etc/shared, and then distributed to the hosts.
If it is necessary to work with Workstation, windows.workstation.yml is used.
Each file contains settings for checking operating systems, and each OS has specific sets of rules. Three files are sent to each host:
- windows.workstation.yml;
- agent.conf;
- merged.mg.
The agent checks the windows.workstation.yml file, which contains a detailed list of checks and their annotations as well as recommendations for setting up group policies.
The agent lets you view detailed inspection statistics. Inspection data is distributed into three categories:
- pass — verification was successful;
- fail — validation error;
- not applicable — verification failed.
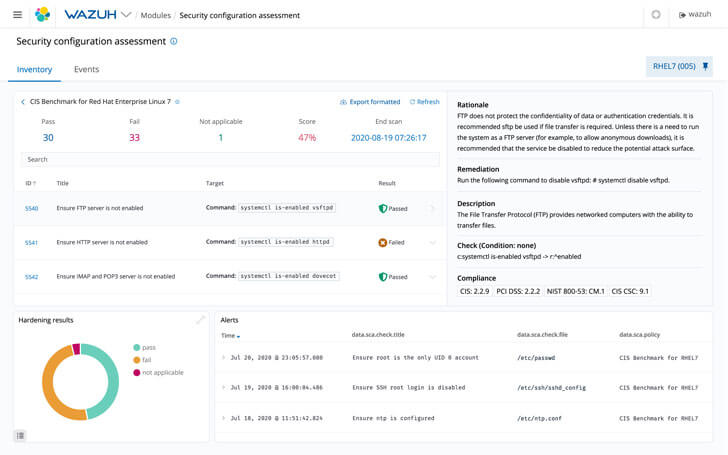
One of the difficulties while working with Wazuh was the inability to check the Windows Server 2022 OS. We managed to solve this problem by editing the sca_win_audit.yml file, which is supposed to check all Windows operating systems. We have replaced some of the contents of the file with all checks for Windows Server 2019. When we first launched a check set up in this way, we got the following approximate distribution of results:
- pass — 60;
- fail — 30;
- not applicable — 161.
Next, we had to manually configure the policy for a group of machines running Windows Server 2022. Wazuh further helped us with our configurations, since a convenient graphical description is displayed for each failed check, which, among other things, provides options for solving the problem and makes recommendations for the correct operation of a particular policy.
The second difficulty - more precisely, inconvenience - is the introduction of a new observation point in the infrastructure. The primary monitoring tool used at our company is Grafana. Naturally, we want to conduct our monitoring from a single point rather than flitting between different services. To solve this problem, we employed the Wazuh API and message tiering.
Far from every message logged b the system warrants the attention of an engineer, so we chose to track only those error messages from the fifth level and above.
An example of a request to get information about events over the last 5 minutes:
GET /wazuh-alert-4.x-2022.03.15/_search&scroll-10
{
	"query": {
		"bool": {
			"must":  {{
					"term":
						"rule.level":  5
					}
				}
				{
					"range": {
						"timestamp": {
							"gte": "now=5m"
						}
					}
				}
		}
	}
}
An example of an answer:
{
  "_index": "wazuh-alerts-4.x-2022.08.24",
 ….
          "message": "\"An account was successfully logged on.\r\n\r\nSubject:\r\n\tSecurity ID:\t\tS-1-0-0\r\n\tAccount Name:\t\t-\r\n\tAccount Domain:\t\t-\r\n\tLogon ID:\t\t0x0\r\n\r\nLogon Information:\r\n\tLogon Type:\t\t3\r\n\tRestricted Admin Mode:\t-\r\n\tVirtual Account:\t\tNo\r\n\tElevated Token:\t\tYes\r\n\r\nImpersonation Level:\t\tImpersonation\r\n\r\nNew Logon:\r\n\tSecurity ID:\t\tS-1-5-21-2526477096-3969226448-3483117384-1204\r\n\tAccount Name:\t\tDCRU02$\r\n\tAccount Domain:\t\tWIN.HOSTKEY.RU\r\n\tLogon ID:\t\t0x1E2DF59\r\n\tLinked Logon ID:\t\t0x0\r\n\tNetwork Account Name:\t-\r\n\tNetwork Account Domain:\t-\r\n\tLogon GUID:\t\t{2cc363a6-1878-3de5-5960-b16d1cf42fb6}\r\n\r\nProcess Information:\r\n\tProcess ID:\t\t0x0\r\n\tProcess Name:\t\t-\r\n\r\nNetwork Information:\r\n\tWorkstation Name:\t-\r\n\tSource Network Address:\t172.17.0.12\r\n\tSource Port:\t\t53356\r\n\r\nDetailed Authentication Information:\r\n\tLogon Process:\t\tKerberos\r\n\tAuthentication Package:\tKerberos\r\n\tTransited Services:\t-\r\n\tPackage Name (NTLM only):\t-\r\n\tKey Length:\t\t0\r\n\r\nThis event is generated when a logon session is created. It is generated on the computer that was accessed.\r\n\r\nThe subject fields indicate the account on the local system which requested the logon. This is most commonly a service such as the Server service, or a local process such as Winlogon.exe or Services.exe.\r\n\r\nThe logon type field indicates the kind of logon that occurred. The most common types are 2 (interactive) and 3 (network).\r\n\r\nThe New Logon fields indicate the account for whom the new logon was created, i.e. the account that was logged on.\r\n\r\nThe network fields indicate where a remote logon request originated. Workstation name is not always available and may be left blank in some cases.\r\n\r\nThe impersonation level field indicates the extent to which a process in the logon session can impersonate.\r\n\r\nThe authentication information fields provide detailed information about this specific logon request.\r\n\t- Logon GUID is a unique identifier that can be used to correlate this event with a KDC event.\r\n\t- Transited services indicate which intermediate services have participated in this logon request.\r\n\t- Package name indicates which sub-protocol was used among the NTLM protocols.\r\n\t- Key length indicates the length of the generated session key. This will be 0 if no session key was requested.\"",
          "version": "2",
…
}
The answer is detailed and informative, but still inconvenient to view. Information from it should be presented in a more concise and easy-to-read format. To do this, Wazuh developers have provided a mechanism for integrating it with other products. In our case, the Rocket messenger system:

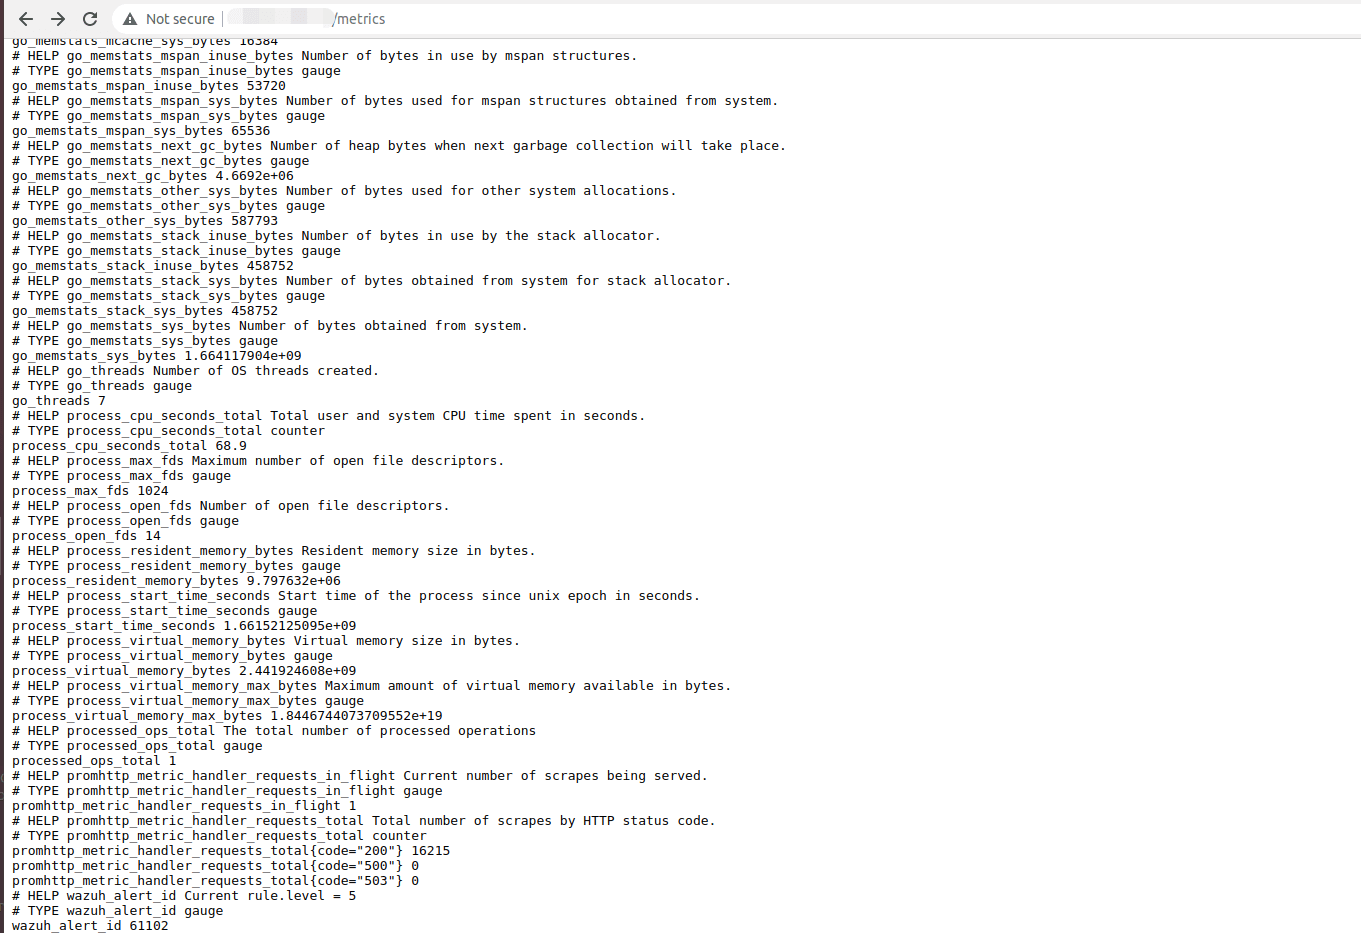
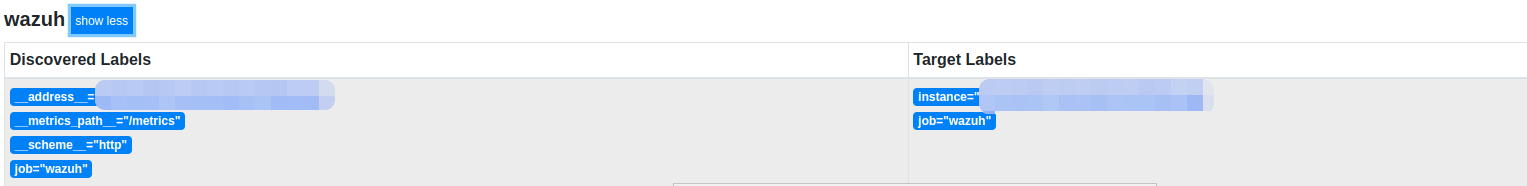
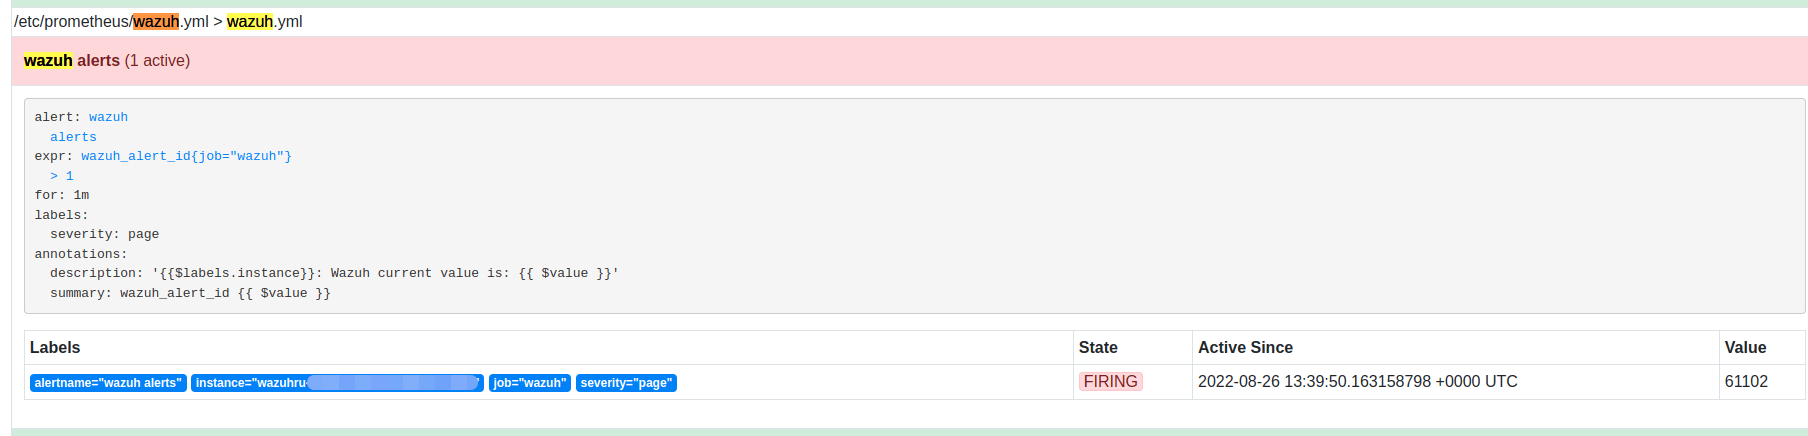
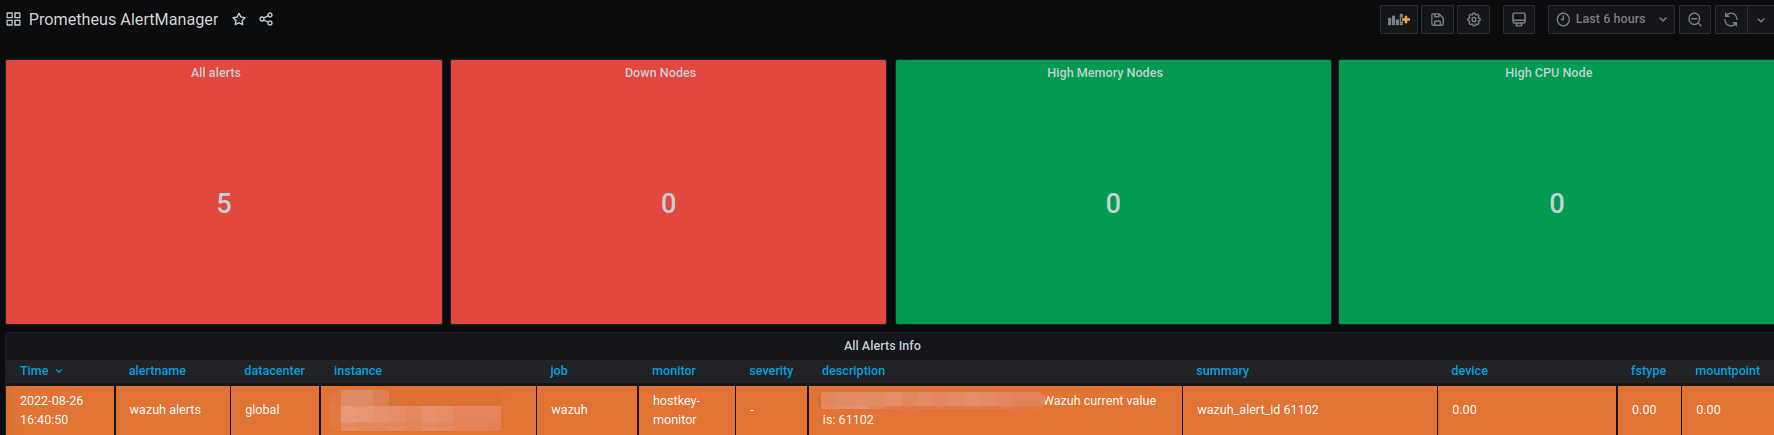
A level 5 error message is also sent to the exporter, from which Prometheus picks up this metric:
The error message is then converted for display in the Grafana service, which we use as our main monitoring tool:
We managed to build a convenient system for monitoring key files and the history of their changes on our servers. The complete setup for the Wazuh monitor took about ten working days and was carried out by one engineer. In the end, Wazuh's automated security configuration assessment looks for failed configurations and helps maintain the default configuration on all managed hosts.