In this article we will share the results of testing a computer assembly based on the Supermicro X13SAE-F motherboard and the new Intel Core i9-14900KF processor overclockable up to 6.0 GHz.
HOSTKEYis a hosting company, and as such it is important for us to update our equipment in a timely manner in order to provide quality service and reduce costs. New equipment always involves a testing phase, as this is a good way to build up our own expertise on new platforms, to study the specifics of their operation, customization and configuration for client tasks.
The latest novelty in our company was a build with an SM X13SAE-F motherboard and a Core i9-14900KF 6.0GHz processor. Let's take a look at what exactly this hardware is, and then we can consider the results of our testing of this configuration, especially given the lack of official results from some test programs.
Dedicated servers with 4th generation AMD EPYC 9354 / 9124 / 9554 / 9754 and Intel Xeon Silver 4416+ processors
Rent a high-performance dedicated server based on the latest generation AMD EPYC and Intel Xeon processors, with DDR5 RAM and NVME storage. Servers are available for order at our state-of-the-art data centers in Amsterdam.
🔶 Installation fee: Free of charge 🔶 Discount of up to 12% depending on the rental period 🔶 Delivery time: next working day
SM X13SAE-F and Intel Core i9-14900KF specifications
SM X13SAE-F motherboard
Form factor | ATX |
Dimensions | 12" x 9.6" (30.48 cm. x 24.38 cm.) |
CPU Support | |
CPU | Intel® CoreTM i3, i5, i7, i9 12th,13th-14th generation processor Supports a single processor LGA1700 (Socket V0) socket, and a processor TDP of up to 150W |
Number of cores | Up to 24 (8+16) cores up to 6 GHz |
RAM support | |
Memory capacity | 4 DIMM slots Up to 192 GB non-registered ECC/non-ECC UDIMM memory, DDR5-4400 MHz |
Memory type | 4400/4000/3600 Mt/s, 192 GB |
DIMM memory module size | 8GB, 16GB, 24GB, 32GB, 48GB UDIMM: 8 GB, 16 GB, 24 GB, 32 GB, 48 GB |
Voltage | 1.1 V |
Integrated devices | |
Chipset | Intel® W680 |
SATA | Intel® W680 controller for 8 SATA3 (6Gbps) ports; RAID 0, 1, 5, 10 support |
IPMI | ASPEED AST2600 BMC |
Audio | ALC888S HD Audio |
Network controllers | One network card with an Intel® PHY I219LM controller, for AMT/vPro One network card with a Realtek RTL8211F PHY controller (dedicated for IPMI), dedicated network for IPMI One NIC with Intel® Ethernet I225-LM controller |
I/O | |
LAN | 1 RJ45 port for a dedicated IPMI network 1 RJ45 port for a Gigabit Ethernet network 1 RJ45 port for a 2.5 Gigabit Ethernet network |
USB | 4 USB 2.0 ports (2 on the rear panel; 2 on the internal connector) 2 USB 3.2 Gen2x2 ports (1 Type C on the rear panel; 1 on the internal connector) 3 USB 3.2 Gen2x1 ports (3 Type A on the rear panel) 3 USB 3.2 Gen1x1 ports (2 on the internal connectors; 1 Type A on the vertical panel) |
Video Output | 1 VGA port, 1 DVI-D port, 1 DP 1.4a port, 1 HDMI 2.0b port |
COM-port | 1 COM port (on the internal connector) |
TPM | 1 connector for a TPM connection |
Expansion slots | |
PCIe | 2 PCIe 5.0 x16 slots (16/NA or 8/8), 2 PCIe 3.0 x4 slots |
M.2 | M.2 interface: 3 PCIe 4.0 x4 slots, RAID 0, 1, 5 support Form Factor: 2280 Key: M-Key |
Note | 1 PCI 32 bit, 5 V |
BIOS system | |
BIOS type | 32 MB SPI Flash with AMI BIOS |
BIOS Features | ACPI 6.0 Plug and Play (PnP) support BIOS recovery with hotkeys Automatic Riser Card Detection Support SMBIOS 3.0 or later version |
Management | |
Software | Redfish API,Supermicro Server Manager (SSM),Supermicro Update Manager (SUM),SuperDoctor® 5,Super Diagnostics Offline,KVM with dedicated LAN,IPMI 2.0 |
System management | SuperDoctor 5 |
Power management | ACPI Power Management power-up mode. Power button override mechanism Wake-on-LAN mechanism |
Security | |
Hardware | Trusted Platform Module (TPM) 2.0 |
Condition monitoring | |
Fan control | VBAT (battery voltage monitoring) System temperature CPU temperature standby voltage 3.3V 1.05 (PCH) standby voltage 5V +5V, +3.3V, +12V (common supply voltages) CPU thermal trip support (CPU thermal protection support) +1.8V PCH |
LED | Power indicator Error indicator |
Fans | 5 4-pin fan connectors (up to 5 fans) Fan speed control Overheating indicator |
Other features | Support for thermal protection of the processor against overheating ACPI Power Management capability Chassis intrusion detection capability ATX power connector ACPI power management support 8-pin connector for 12V connection. |
SM X13SAE-F is suitable for use in high-performance servers. Firstly, it supports the latest powerful 14th generation Intel processors with a large number of cores and high clock speeds.
Secondly, the board has a high memory bandwidth of up to 192Gb using DDR5 modules. Fast memory access is critical for server workloads.
SM X13SAE-F is equipped with a fast storage subsystem: 8 SATA3 ports and 3 M.2 PCIe 4.0 x4 slots with RAID support. High-speed PCIe 5.0 and PCIe 4.0 interfaces allow you to connect high-performance additional components.
The board also supports virtualization and remote management technologies, which is important for servers. Monitoring functions track the status of all components in real time.
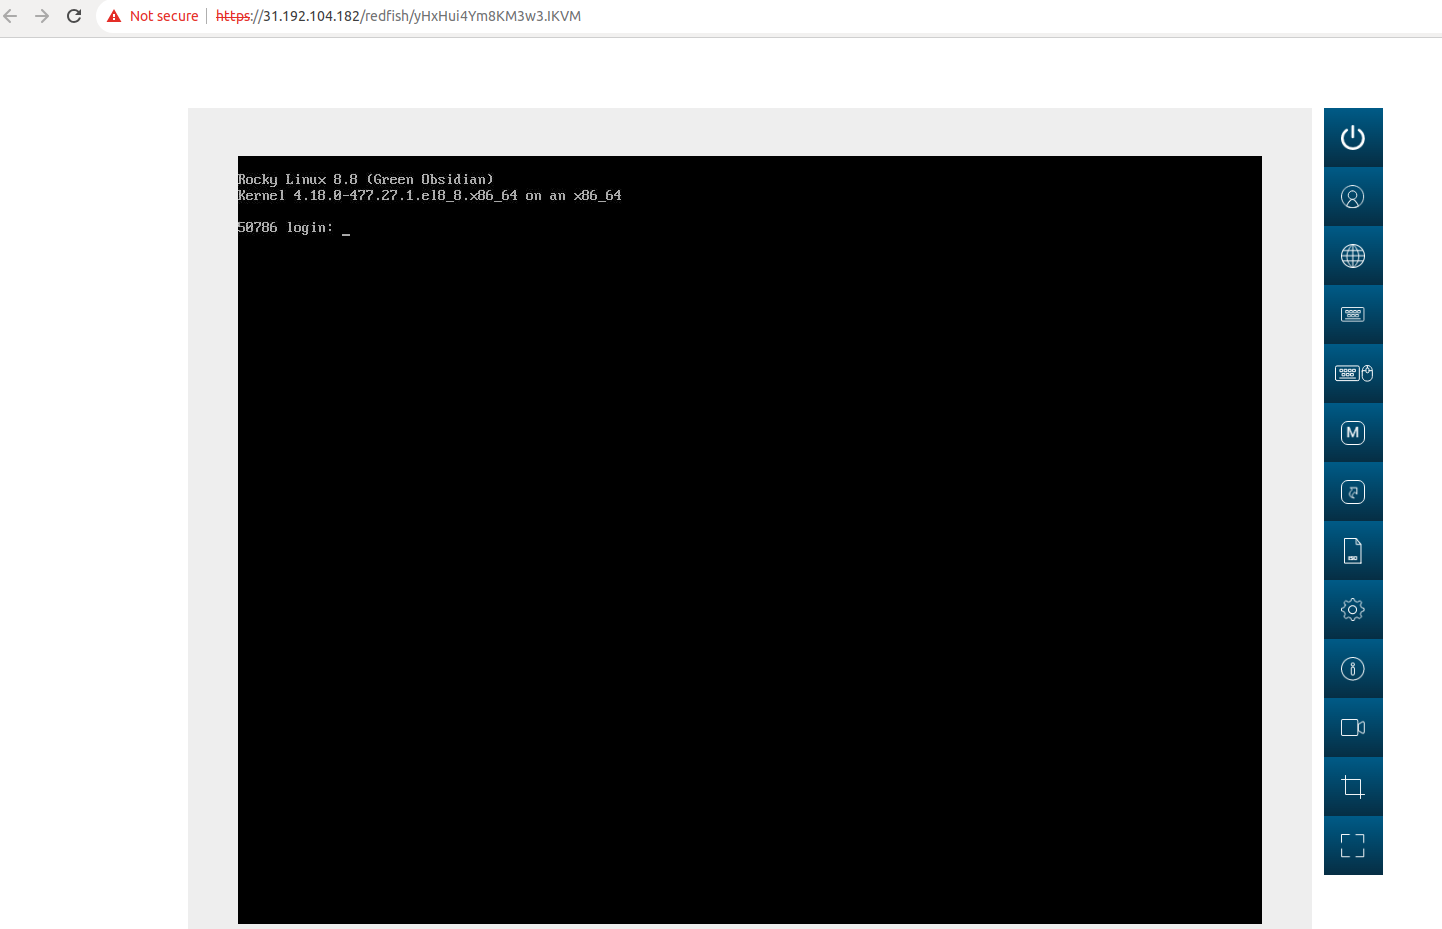
An additional advantage when working with the SM X13SAE-F motherboard is the ability to directly control the hardware via an HTML5 console:
Intel Core i9-14900KF 6.0GHz processor
Processor model number | i9-14900KF |
Total number of cores | 24 |
Number of cores for performance | 8 |
Number of cores for efficiency | 16 |
Total number of threads | 32 |
Maximum turbo frequency | 6 GHz |
Intel® Thermal Velocity Boost frequency | 6 GHz |
Intel® Turbo Boost Max 3.0 Technology | 5.8 GHz |
Maximum Turbo Boost Frequency for Performance | 5.6 GHz |
Maximum turbo frequency for efficiency | 4.4 GHz |
Base frequency for performance | 3.2 GHz |
Base frequency for efficiency | 2.4 GHz |
Cache | 36 MB Intel® Smart Cache |
36 MB Intel® Smart Cache | 32 MB |
Base level processor power | 125 W |
Maximum power | 253 W |
Supported memory types | Up to DDR5 5600 MT/s Up to DDR4 3200 MT/s |
Maximum memory capacity | 192 GB |
Maximum number of memory channels | 2 |
Maximum memory bandwidth | 89.6 Gbps |
Expansion Connectors | Direct Media Interface (DMI) version 4.0 Up to 8 lanes PCI Express version 5.0 and 4.0 |
Maximum number of PCI Express slots | 20 |
Supported sockets | LGA1700 |
This processor is well suited for use in server systems. Its hybrid architecture with 24 cores (8 high-performance and 16 energy-efficient cores) provides an excellent balance of performance and power consumption. The presence of cutting-edge Intel technologies is also an important advantage.
A sufficient number of cores and high clock frequencies (up to 6 GHz) allow it to efficiently cope with multi-threaded loads typical for web servers and other server segment tasks. Support for 32 threads and 36 MB of cache also scales well for server tasks.
The large amount of supported RAM (up to 192 GB), high bandwidth (up to 89.6 Gbps) and modern DDR5 memory interface are also important advantages for creating a productive server.
Testing
Description of the test environment
We prepared two identical builds for the tests. By running the same tests on each, we can track anomalies and get relevant results.
Server 1 | Server 2 | |
Motherboard | SM X13SAE-F | SM X13SAE-F |
CPU | Core i9-14900KF 6.0GHz (24 cores) | Core i9-14900KF 6.0GHz (24 cores) |
RAM | 4x 32 GB DDR5 | 4x 32 GB DDR5 |
Drive | 2x500GB NVMe SSD | 2x500GB NVMe SSD |
Power supply | PSU 2000W | PSU 2000W |
Network card | Intel X520-DA2 2xSFP+ | Intel X520-DA2 2xSFP+ |
Test
nench.sh
curl —s wget.racing/nench.sh | bash; curl —s wget.racing/nench.sh | bash) 2>&1 | tee nench.logServer 1
CPU (less is better)
SHA256-hashing 500 MB | 0,224 sec. |
AES-encrypting 500 MB | 0,386 sec. |
Ioping (less is better)
seek rate | 44.0 us / 56.2 us / 144.3 us / 8.82 us |
sequential read speed | generated 54,600 requests in 5.00 seconds, 13.3 GB, 10.9 to iops, 2.67 Gbps. |
dd (less is better, Mbps)
1st run | 1430.51 |
2nd run | 1335.14 |
3rd run | 1335.14 |
average | 1366.93 |
IPv4 speed tests (less is better, Mbps)
Cachefly CDN | 107.99 |
Leaseweb (NL) | 0.11 |
Online.net (FR) | 48.63 |
OVH BHS (CA) | 16.59 |
Server 2
CPU (less is better)
SHA256-hashing 500 MB | 0,225 sec. |
AES-encrypting 500 MB | 0,323 sec. |
Ioping (less is better)
seek rate | 44.3 us / 57.3 us / 114.3 us / 8.66 us |
sequential read speed | generated 54,700 requests in 5.00 seconds, 13.3 GB, 10.9 to iops, 2.67 Gbps. |
dd (less is better, Mbps)
1st run: | 1430.51 |
2nd run | 1430.51 |
3rd run | 1335.14 |
average | 1398.72 |
IPv4 speed tests (less is better, Mbps)
Cachefly CDN | 108.11 |
Leaseweb (NL) | 0.11 |
Online.net (FR) | 49.59 |
OVH BHS (CA) | 16.60 |
Iperf3 test results
An iperf3 test was run between a local client and a remote server. The test included 10 parallel threads and was executed for 10 seconds on each thread.
The first test
Total throughput capacity | |
Total transmission volume (10 sec.) | Total transmission capacity |
2.03 GB | 1.75 Gbps |
Results by individual streams | |||
Flow number | Average transmission volume (10 sec, MB ) | Average bandwidth (Mbps) | Repeated transmissions |
5 | 180 | 151 | 164 |
7 | 519 | 435 | 859 |
9 | 263 | 221 | 110 |
11 | 132 | 110 | 395 |
13 | 134 | 112 | 78 |
15 | 238 | 200 | 131 |
17 | 95 | 79.7 | 216 |
19 | 225 | 189 | 318 |
21 | 145 | 122 | 335 |
23 | 150 | 126 | 116 |
The second test
Total throughput capacity | |
Total transmission volume (10 sec) | Total throughput capacity |
1.23 GB | 1.05 Gbps |
Results by individual stream | |||
Flow number | Average transmission volume (10 sec, MB ) | Average bandwidth (Mbps) | Repeated transmissions |
5 | 120 | 101 | 7 |
7 | 126 | 105 | 2 |
9 | 99.9 | 83.8 | 4 |
11 | 138 | 116 | 2 |
13 | 208 | 174 | 1 |
15 | 192 | 161 | 3 |
17 | 61.4 | 51.5 | 5 |
19 | 84.0 | 70.4 | 5 |
21 | 91.8 | 77.0 | 4 |
23 | 136 | 114 | 1 |
The third test
Total throughput capacity | |
Total transmission volume (10 sec) | Total throughput capacity |
10.7 GB | 9.22 Gbps |
Results by individual streams | |||
Flow number | Average transmission volume (10 sec, MB ) | Average bandwidth (Mbps) | Repeated transmissions |
5 | 1.02 | 858 | 6 |
7 | 1.04 | 895 | 9 |
9 | 1.00 | 860 | 8 |
11 | 1.02 | 858 | 4 |
13 | 1.14 | 978 | 7 |
15 | 1.14 | 980 | 7 |
17 | 1.14 | 978 | 3 |
19 | 1.14 | 978 | 8 |
21 | 1.02 | 855 | 4 |
23 | 1.14 | 976 | 9 |
The fourth test
Total throughput capacity | |
Total transmission volume (10 sec) | Total throughput capacity |
11.0 GB | 9.45 Gbps |
Results by individual streams | |||
Flow number | Average transmission volume (10 sec, MB ) | Average bandwidth (Mbps) | Repeated transmissions |
5 | 854 | 717 | 7 |
7 | 860 | 721 | 7 |
9 | 854 | 717 | 22 |
11 | 856 | 718 | 10 |
13 | 857 | 719 | 18 |
15 | 3480 | 2990 | 7 |
17 | 855 | 718 | 6 |
19 | 856 | 718 | 15 |
21 | 857 | 719 | 12 |
23 | 854 | 717 | 6 |
In the first test, the total amount of data transferred was 2.03 GB with an average throughput of 1.75 Gbps. The highest throughput of 435 Mbps was observed on stream 7. There were also over 100 retransmissions on multiple streams indicating packet loss.
In the second reverse mode test, the total amount of data received was 1.23 GB and the total throughput was 1.05 Gbps. The average throughput varied between streams from 51.5 to 174 Mbps. Maximum retransmissions (5) on streams 5 and 19.
In the third test, 10.7 GB of data were transferred at an average rate of 9.22 Gbps. The throughput of the streams ranged from 855 to 978 Mbps with few retransmissions.
The fourth test transferred 11 GB at an average rate of 9.45 Gbps. A single stream achieved a record throughput of 2.99 Gbps. The number of retransmissions was up to 22 on individual streams.
librespeed
./librespeed-cli --server-json https://speedtest.hostkey.com/servers.json --server 1 dw | 306.6 Mbps |
upload | 309.23 Mbps |
Using the librespeed-cli utility, we tested our internet speed on the speedtest.imd.com server located in the Netherlands.
The download and upload speeds were measured. The download speed was 306.6 Mbps - a pretty decent result, indicating fast and stable downloading of content. The upload speed was 309.23 Mbps - also above average, which is important for transferring large amounts of data. Another plus is that the download and upload speeds are about the same.
In general, the test showed excellent results - fast and stable connection without obvious bottlenecks when downloading and uploading data
Stress- ng
stress-ng --cpu 24 --io 4 --vm 1 --vm-bytes 16G --timeout 60s --metrics-briefstressor | bogo ops (secs) | real time (secs) | usr time (secs) | sys time (secs) | bogo ops/s (real time) | bogo ops/s (usr+sys time) | |
Intel Core i9-14900KF | cpu | 2074846 | 60 | 1437.94 | 0.02 | 34579.44 | 1442.91 |
io | 266706 | 59.90 | 0.42 | 11.54 | 4452.51 | 22299.80 | |
vm | 3856467 | 60.12 | 49.09 | 10.95 | 64142.65 | 64237.82 |
stress-ng --cpu 32 --io 4 --vm 1 --vm-bytes 32G --timeout 60s --metrics-briefstressor | bogo ops (secs) | real time (secs) | usr time (secs) | sys time (secs) | bogo ops/s (real time) | bogo ops/s (usr+sys time) | |
AMD Ryzen 9 5950X | cpu | 2509636 | 60.01 | 1754.82 | 0.55 | 41823.2 | 1429.69 |
io | 14076 | 60.03 | 0.05 | 0.94 | 234.49 | 14196.47 | |
vm | 5748301 | 61.58 | 109.74 | 42.2 | 93352.83 | 37833.13 |
stress-ng --cpu 32 --io 8 --vm 4 --vm-bytes 128G --timeout 60s --metrics-briefstressor | bogo ops (secs) | real time (secs) | usr time (secs) | sys time (secs) | bogo ops/s (real time) | bogo ops/s (usr+sys time) | |
AMD Ryzen 9 7950X | cpu | 3240575 | 60 | 1673.25 | 7.21 | 54008.35 | 1928.39 |
io | 595084 | 60 | 1.05 | 15.93 | 9917.64 | 35034.97 | |
vm | 337066 | 62.65 | 87.94 | 115.35 | 5379.81 | 1657.99 |
According to the results of the CPU performance test (bogo ops), the best result was shown by AMD Ryzen 9 7950X processor - 3240575 bogo ops. The second place went to the Intel Core i9-14900KF at 2074846 bogo ops. AMD Ryzen 9 5950X showed a result of 2509636 bogo ops.
In the I/O (io) performance test, the AMD Ryzen 9 7950X is the leader with a result of 595084 bogo ops. The second place is held by the Intel Core i9-14900KF with 266706 bogo ops. The lowest result went to the AMD Ryzen 9 5950X at 14076 bogo ops.
In the virtual memory (vm) performance test, the best result was also the AMD Ryzen 9 7950X at 337066 bogo ops. Intel Core i9-14900 KF was in second place with 3856467 bogo ops. The AMD Ryzen 9 5950X took the third place with 5748301 bogo ops.
Thus, according to the sum of the scores of all the tests, the most productive processor is the AMD Ryzen 9 7950X. In second place is the Intel Core i9-14900KF. The AMD Ryzen 9 5950X showed the lowest performance among the tested processors.
Based on the test data, we can draw some conclusions about the preferred applications of these processors.
Firstly, the AMD Ryzen 9 7950X performed better in CPU and I/O performance tests. It is best suited for applications that require high processing power and fast data access, such as scientific computing, machine learning, and video rendering.
Secondly, although the Intel Core i9-14900KF is inferior in overall performance, it scored well in the virtual memory performance test. It is well suited for memory-intensive tasks such as compiling code or working with databases.
Thirdly, the AMD Ryzen 9 5950X lags behind its competitors in almost all indicators. Nevertheless, its performance is high enough for most tasks. In terms of price to features ratio, it can be a good solution for gaming and everyday tasks.
Drives
stress-ng --sequential 0 --class io --timeout 60s --metrics-briefstressor | bogo ops | real time (secs) | usr time (secs) | sys time (secs) | bogo ops/s (real time) | bogo ops/s (usr+sys time) | ||
Intel Core i9-14900KF | aio | 3305101 | 60.03 | 3.40 | 18.25 | 55057.20 | 152646.99 | |
aiol | 614934 | 60.03 | 20.84 | 21.20 | 10243.06 | 14628.54 | ||
hdd | 3979264 | 60.23 | 35.27 | 70.80 | 66064.04 | 37516.06 | ||
rawdev | 8385081 | 60.00 | 1.68 | 11.69 | 139747.22 | 627158.04 | ||
readahead | 1631392 | 60.03 | 0.13 | 16.46 | 27178.23 | 98323.20 | ||
revio | 300219039 | 60.01 | 35.44 | 1866.83 | 5002886.40 | 157822.10 | ||
seek | 140980004 | 60.01 | 118.19 | 1790.73 | 2349305.22 | 73853.15 | ||
sync-file | 91395 | 60.00 | 4.70 | 33.57 | 1523.20 | 2388.14 | ||
7950X | aio | 4216227 | 60.11 | 3.44 | 18.67 | 70144.56 | 190678.74 | |
aiol | 614553 | 60.11 | 14.33 | 43.39 | 10224.4 | 10646.98 | ||
hdd | 4275200 | 60.14 | 96.84 | 128.57 | 71093.06 | 18966.11 | ||
rawdev | 866453 | 60 | 2.05 | 36.19 | 347771.34 | 545582.5 | ||
readahead | 2608140 | 60.01 | 0.44 | 39.55 | 43459.6 | 65209.08 | ||
revio | 267332942 | 60.1 | 49.22 | 1846.64 | 4448303.11 | 141008.43 | ||
seek | 0 | 60.01 | 111.47 | 1807.18 | 0 | 0 | ||
sync-file | 95264 | 60 | 9.38 | 37.52 | 1587.62 | 2031.12 | ||
5950X | aio | 1888993 | 60.03 | 1.86 | 12.27 | 31468.87 | 133655.35 | |
aiol | 744673 | 60.12 | 30.38 | 64.97 | 12385.6 | 7810.11 | ||
hdd | 985088 | 60.9 | 25.8 | 38.92 | 16175.11 | 15222.32 | ||
rawdev | 18115648 | 60 | 2.12 | 60.45 | 301926.12 | 289528.49 | ||
readahead | 4562553 | 60.01 | 1.55 | 29.12 | 76035.53 | 148741.54 | ||
revio | 219069788 | 60.02 | 37.27 | 1872.58 | 3650238.34 | 114705.27 | ||
seek | 0 | 60.01 | 222.08 | 1695.37 | 0 | 0 | ||
sync-file | 113792 | 60 | 8.81 | 43.38 | 1896.46 | 2180.3 | ||
In the aio (asynchronous I/O) performance test, the best result was shown by the AMD Ryzen 9 7950X at 4216227 bogo ops. Second place went to the Intel Core i9-14900KF with a result of 3305101 bogo ops. The AMD Ryzen 9 5950X holds the third place at 1888993 bogo ops.
In the aiol (linear asynchronous I/O) test, the Intel Core i9-14900KF leads with a score of 614934 bogo ops. The AMD Ryzen 9 7950X took the second place with 614553 bogo ops. The AMD Ryzen 9 5950X came in third place with 744673 bogo ops.
On the hard drive (hdd) performance test, the Intel Core i9-14900KF posted the highest score with 3979264 bogo ops. The AMD Ryzen 9 7950X trails behind at 4275200 bogo ops. The AMD Ryzen 9 5950X took the lowest result at 985088 bogo ops.
The AMD Ryzen 9 7950X leads on the aggregate of all tests, with the Intel Core i9-14900KF in second place and the AMD Ryzen 9 5950X showed the lowest performance.
Thus, the AMD Ryzen 9 7950X is best suited for compute-intensive tasks and asynchronous I/O. The Intel Core i9-14900KF is good for linear I/O and storage work. The AMD Ryzen 9 5950X is inferior in performance but can be a viable alternative with a better price to feature ratio.
Supermicro Super Server
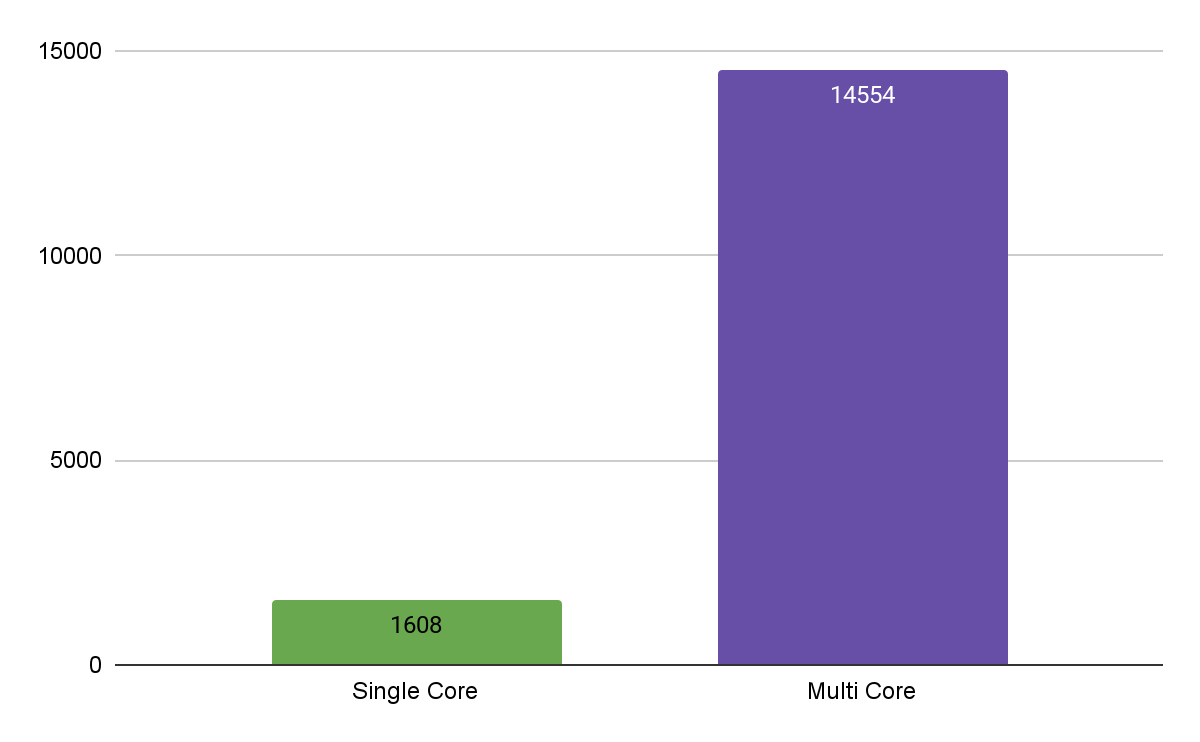
In the single core performance test, a result of 1608 points was obtained. This indicates a fairly high speed of execution of sequential tasks on a single core.
In the multithreaded test, which involved all processor cores, the server showed a result of 14 554 points. This indicates a good performance for the server in parallel data processing on all the cores.
Thus, the tests showed that the server has high computing power for both sequential and parallel tasks. It is suitable for a wide range of computational work requiring fast performance.
CPU Z
CPU Single Thread | 980.6 |
CPU Multi Thread | 15587.3 |
Multi Thread Ratio | 15.90 |
CPUID HWMonitor. Temperatures (C)
Value | Min | Max | |
Supermicro X13SAE-F | |||
TZ00 | 27.8 | 27.8 | 27.8 |
SYSTIN | 6.0 | 5.0 | 14.0 |
TMPIN5 | 127 | 127 | 127 |
TMPIN6 | 6.0 | 5.0 | 14.0 |
TMPIN8 | 105.0 | 105.0 | 106.0 |
AUXTIN0 | 23.0 | 23.0 | 23.0 |
AUXTIN1 | 0.0 | 0.0 | 127.0 |
AUXTIN2 | 105.0 | 105.0 | 106.0 |
AUXTIN3 | 106.0 | 104.0 | 106.0 |
AUXTIN4 | 24.0 | 24.0 | 24.0 |
TMPIN3 | 40 | 40 | 40 |
Intel Core i9 14900KF | |||
Package | 7.0 | 3.0 | 55.0 |
P-Cores (Max) | 7.0 | 2.0 | 55.0 |
E-Cores (Max) | 7.0 | 3.0 | 51.0 |
The results of the CPU performance tests showed the following:
- In the single-thread test, the CPU scored 980.6 points, which indicates a high speed of processing sequential tasks.
- In the multithreaded test, the result was 15587.3 points, and the ratio to the single thread test was 15.9. This indicates the efficiency of the processor in parallelizing calculations.
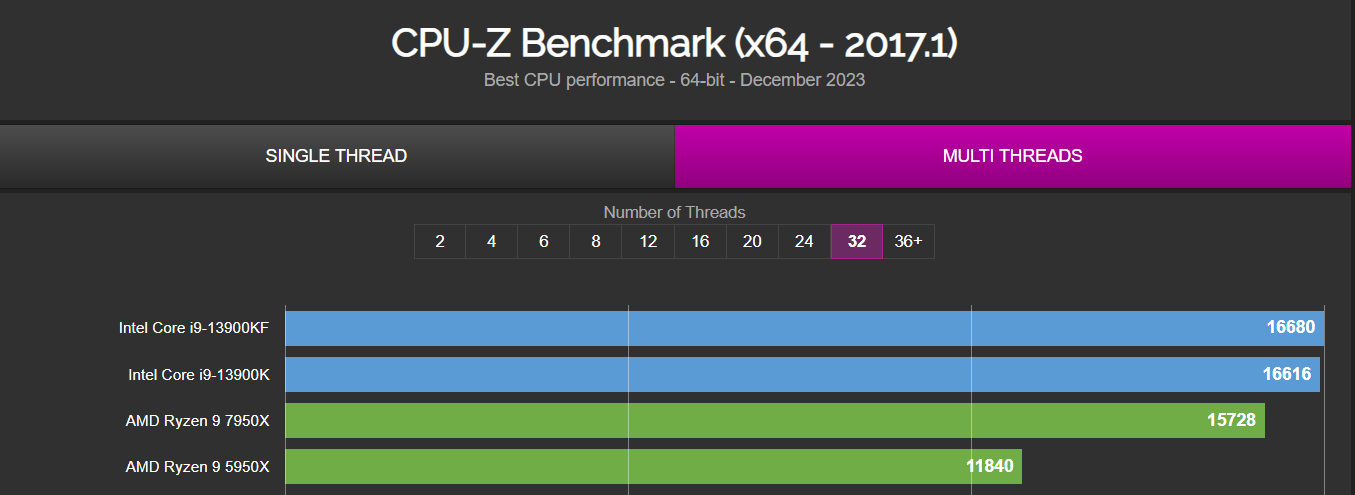
If we look at the official corporate results, our findings were quite close to the optimal ones obtained by the authors of CPU-Z (the i9-13900KF processor is weaker than the 14900KF by 5-10 per cent), but close to the real ones. In turn, the "test" advantage of the 14900KF over the Ryzen 9 7950X in real life is insignificant.
Temperature monitoring showed that in the Supermicro X13SAE-F system the temperatures are normal and do not exceed the maximum values. For the Intel Core i9 14900KF processor, the maximum package temperature reached 55 degrees Celsius. Temperatures of individual cores also did not exceed the norm.
Thus, the tests confirm the high performance and stability of the system under various loads. Critical overheating of components was not observed; at least the new (old) Intel processor is no worse than the 13th generation.
Conclusion
The tests of the new server assembly based on the Supermicro X13SAE-F motherboard and the Intel Core i9-14900KF processor conducted within the framework of this research allow us to draw the following conclusions:
- The system configuration is quite successful and corresponds to the tasks of building a high-performance server solution. The motherboard provides support for the most modern components, a large amount of RAM and high-speed drive connection interfaces.
- The new 24-core processor is capable of processing large data sets both sequentially and in parallel in a short period of time. Its performance remains consistently high both on a single core and at full utilization of all resources.
- The results of the network and drive performance tests show a well-balanced system; i.e. there are no obvious bottlenecks that reduce overall speed.
- The temperature behavior of the components remains nominal despite intensive loads. This is evidence of the correct selection of the cooling system components.
The testing confirms the high potential of servers based on the Supermicro X13SAE-F and the Intel Core i9-14900KF for solving the widest range of computing tasks. The infrastructure is suitable for deploying large-scale projects related to big data analysis, machine learning and other resource-intensive applications.
Dedicated servers with 4th generation AMD EPYC 9354 / 9124 / 9554 / 9754 and Intel Xeon Silver 4416+ processors
Rent a high-performance dedicated server based on the latest generation AMD EPYC and Intel Xeon processors, with DDR5 RAM and NVME storage. Servers are available for order at our state-of-the-art data centers in Amsterdam.
🔶 Installation fee: Free of charge 🔶 Discount of up to 12% depending on the rental period 🔶 Delivery time: next working day