Super sale on 4th Gen EPYC servers with 10 Gbps ⭐ from €259/month or €0.36/hour
EN
Currency:
EUR – €
Choose a currency
  • Euro EUR – €
  • United States dollar USD – $
VAT:
OT 0%
Choose your country (VAT)
  • OT All others 0%

31.10.2022

Monitoring Linux Services with Prometheus

server one
HOSTKEY
Rent dedicated and virtual servers with instant deployment in reliable TIER III class data centers in the Netherlands and the USA. Free protection against DDoS attacks included, and your server will be ready for work in as little as 15 minutes. 24/7 Customer Support.

Author: Senior Devops. Hostkey Lead Infrastructure Specialist Nikita Zubarev

In the last article we talked about how to set up metric collection and the display alerts to monitor services using Prometheus. However, during the process, the question arose of how to monitor individual services on Linux servers. For example, in one of our previous articles, we described the case of using Ovirt web consoles using Apache Guacamole. Now let's look at how to organize the monitoring of services on Linux machines.

Guacamole is a cross-platform remote desktop gateway that requires Apache Tomcat and Guacd to run.

Open the service created for node_exporter:

/usr/lib/systemd/system/node_exporter.service

[Unit]

Description=Prometheus exporter for machine metrics, written in Go with pluggable metric collectors.
Documentation=https://github.com/prometheus/node_exporter
After=network.target


[Service]

EnvironmentFile=-/etc/default/node_exporter
User=root
ExecStart=/usr/bin/node_exporter $NODE_EXPORTER_OPTS
Restart=on-failure
RestartSec=5s

[Install]

WantedBy=multi-user.target

by default, $NODE_EXPORTER_OPTS is loaded from the file:
# /etc/default/node_exporter


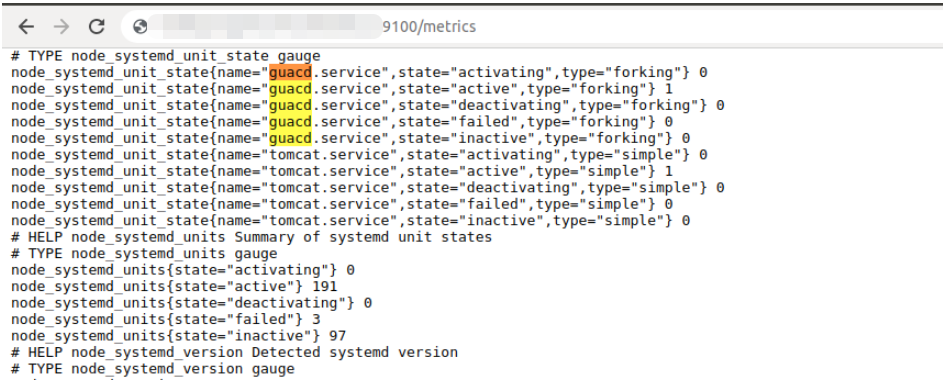
If necessary, we can either monitor individual services by adding the collector.systemd.unit-whitelist option:

#NODE_EXPORTER_OPTS="--collector.systemd --collector.systemd.unit-whitelist="(tomcat|guacd).service""

After restarting the service, we get the metric on node_exporter:

All you need to do is describe the rule for the alert:

- alert: guacd_service
	expr: node_systemd_unit_state{name="guacd.service",state="active"} == 0
	for: 1s
	annotations:
		summary: "Instance {{ $labels.instance }} is down"
		description: "{{ $labels.instance }} of job {{ $labels.job }} is down."
- alert: tomcat_service
	expr: node_systemd_unit_state{name="tomcat.service",state="active"} == 0
	for: 1s
	annotations:
		summary: "Instance {{ $labels.instance }} is down"
		description: "{{ $labels.instance }} of job {{ $labels.job }} is down."

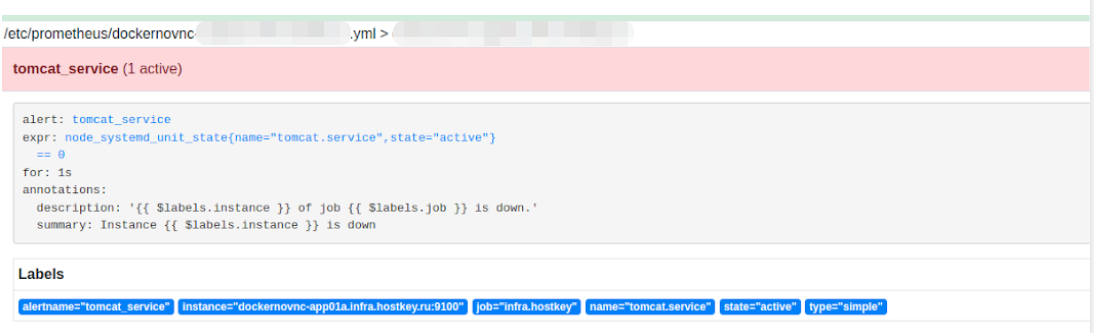
An example of an alert on the Alertmanager dashboard in Grafana:

Conclusions

In this short article, we looked at how services are monitored on Linux machines.This solution allows you to monitor the work of any system server and greatly simplifies the administration of server hardware. In the next article, we will explain how you should not display the basic parameters that the exporter returns.

Rent dedicated and virtual servers with instant deployment in reliable TIER III class data centers in the Netherlands and the USA. Free protection against DDoS attacks included, and your server will be ready for work in as little as 15 minutes. 24/7 Customer Support.

Other articles

27.10.2025

Checklist: 5 Signs It's Time for Your Business to Upgrade from VPS to a Dedicated Server

Do you still rely on cloud services despite paying for them? If your budget is at least €50 per year, a dedicated server could be more cost-effective. Please review the checklist and the comparative tests between cloud and bare-metal solutions.

29.09.2025

What to Do If Your Laptop Breaks Down? How Kasm Turns Even an Old Tablet into a Workstation

When technical issues disrupt work, Kasm Workspaces becomes a lifesaver, turning outdated devices into powerful workstations through a browser. The article discusses how the platform addresses issues with broken laptops and equipment shortages, compares different versions (Community, Starter, Enterprise, Cloud), examines resource requirements, and reviews test results on VPS.

24.09.2025

Replacing Google Meet and Microsoft Teams: Jitsi Meet and Other Alternatives for Business

If you’re in the market for a replacement for Google Meet—just like we were—we’ve got options for you: Zoom, NextCloud, or self-hosted solutions. After thorough testing, we decided on Jitsi Meet on a VPS and have put it to use in real-world scenarios. We’d love to share our insights and any potential pitfalls you should be aware of.

23.09.2025

Monitoring SSL Certificates in oVirt Engine: How We Achieved Peace of Mind with the Help of Go and Prometheus

Looking to prevent system downtime caused by expired SSL certificates? At Hostkey, we’ve developed a user-friendly yet reliable tool built on Go that seamlessly integrates with Prometheus and Grafana. Our system promptly notifies you of potential issues before they become critical.

05.09.2025

Is a Cheap VPS Enough? A Performance Comparison of VPS Plans

Is it worth saving on a VPS or should you opt for a plan with a buffer? We tested three budget HOSTKEY configurations and clearly show which tasks the minimal plan can handle and where it's wiser to invest in a more powerful server.

Upload