Author: Nikita Vypryazhkin, Junior DevOps
Network traffic is like water flowing in a river—someone can just stand on the shore and watch it flow, or they can dive deeper to understand where each drop comes from, where it’s going, and what happens along the way. Most administrators settle for the former option, but those who truly want to control their infrastructure choose the latter.
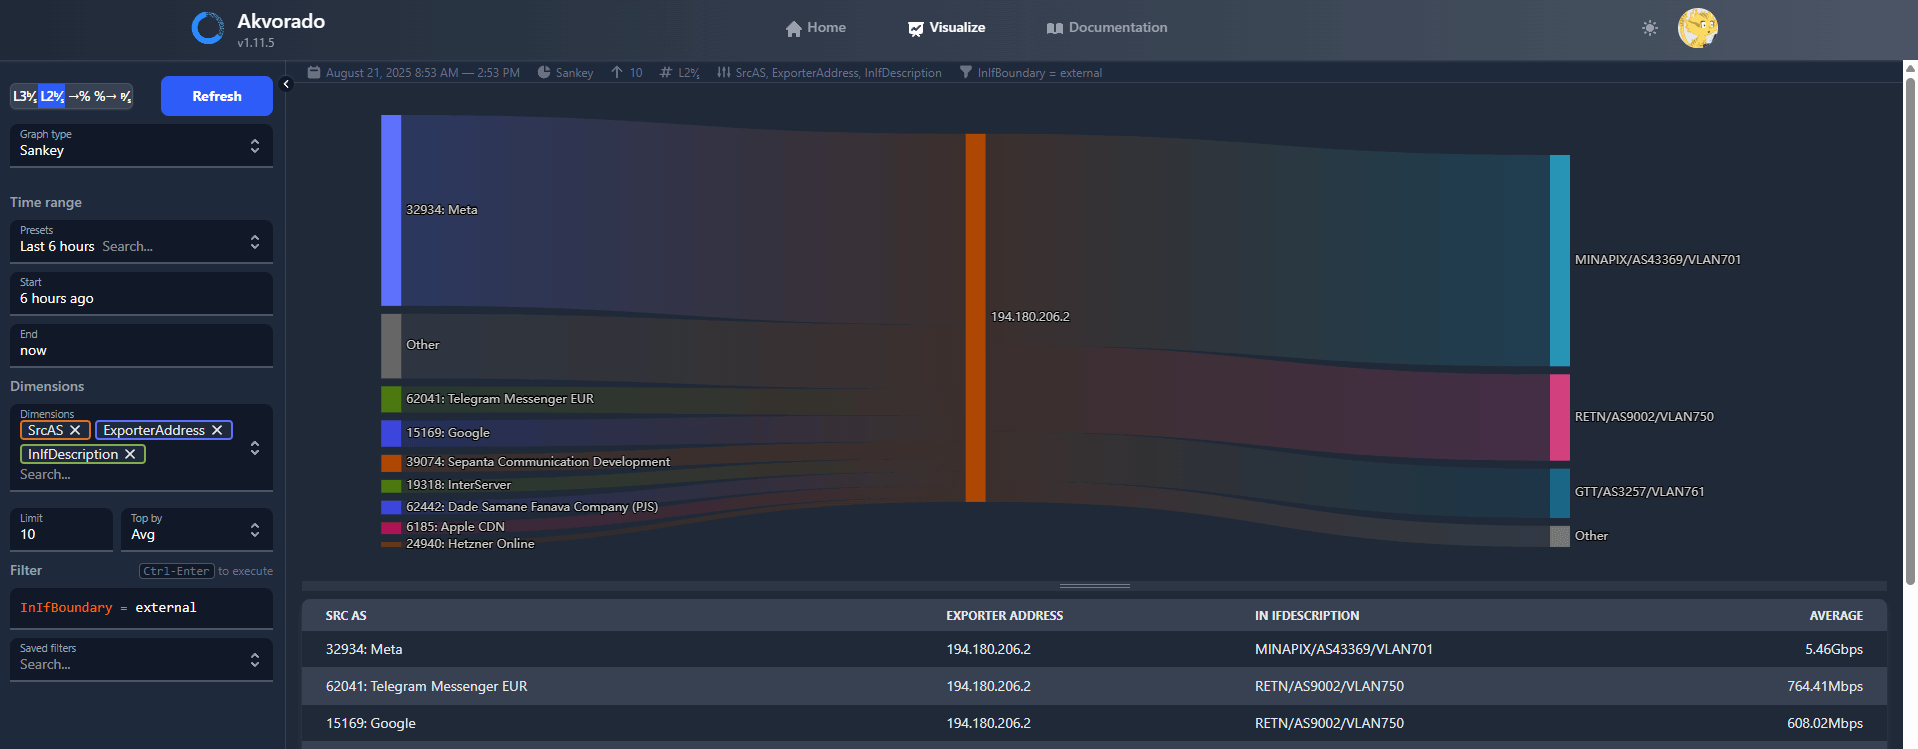
Akvorado is designed precisely for this purpose. It processes data from protocols like NetFlow, sFlow, and IPFIX, turning abstract numbers into a clear and understandable representation of network activity—minus the need for complex setup or configuration.
Who This Guide Is For?
This guide is perfect for professionals in various fields:
- Network Engineers: To identify and resolve performance issues. When users complain about slow internet speeds, Akvorado provides detailed data on traffic generation, dominant protocols, and any anomalies.
- Security Professionals: As an early warning system; it helps detect large-scale scans, suspicious connections, and DDoS attacks by analyzing network traffic. It’s especially useful for tracking the origin and destination of traffic.
- DevOps Engineers: To optimize microservice architectures. When multiple services interact over the network, understanding their interaction patterns is crucial. Akvorado shows who is communicating with whom and how intensively.
- IT Managers: To make informed decisions about budget allocation. Data on actual bandwidth usage speaks louder than any assumptions. For example, whether to expand a connection to a branch office or block specific services (like YouTube).
Part 1: The Architecture — Each Component of the “Orchestration” System
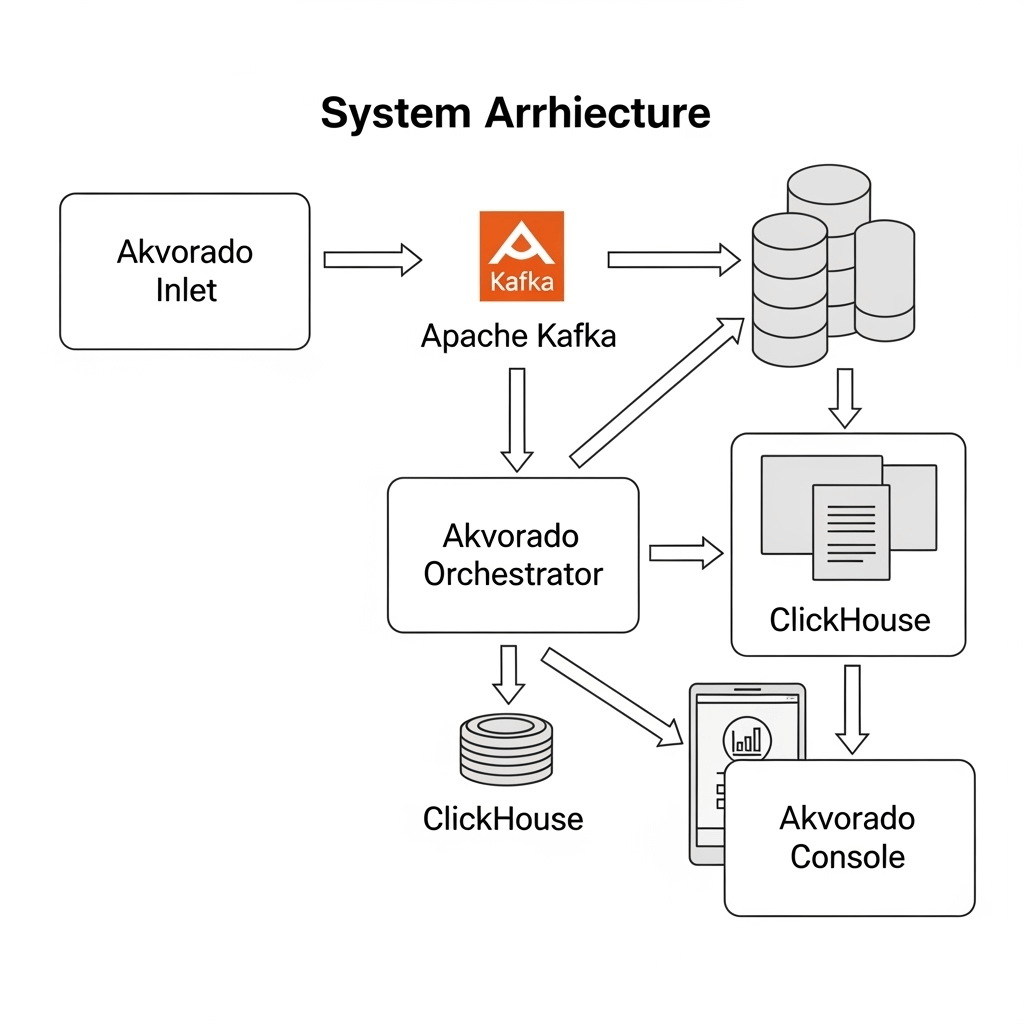
Akvorado isn’t a monolithic application; it’s a set of interconnected services, each with its own role:
1. Akvorado Inlet
The inlet acts as the gateway, receiving data from network devices via UDP (e.g., port 2055/udp for NetFlow). Its main task is to efficiently forward packets to Kafka without any delays.
2. Apache Kafka
Kafka serves as the central storage and buffer. It’s designed for reliability and scalability, holding data until other services can process it. This ensures asynchronous processing and system resilience during DDoS attacks.
3. Akvorado Orchestrator: The Brain of the System
Akvorado Orchestrator is the core component that processes raw data received from Kafka, transforming it into meaningful information. This process involves adding additional details such as geographic location, ASN (Address Space Numbering), and host names.
4. ClickHouse
As a fast, open-source columnar database, ClickHouse is ideal for analyzing large datasets. It handles complex queries in seconds, making data exploration effortless.
5. Akvorado Console
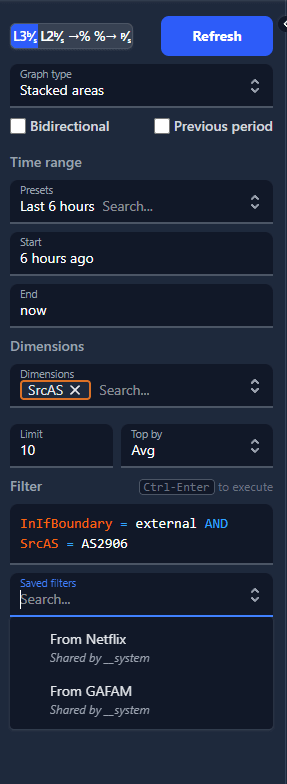
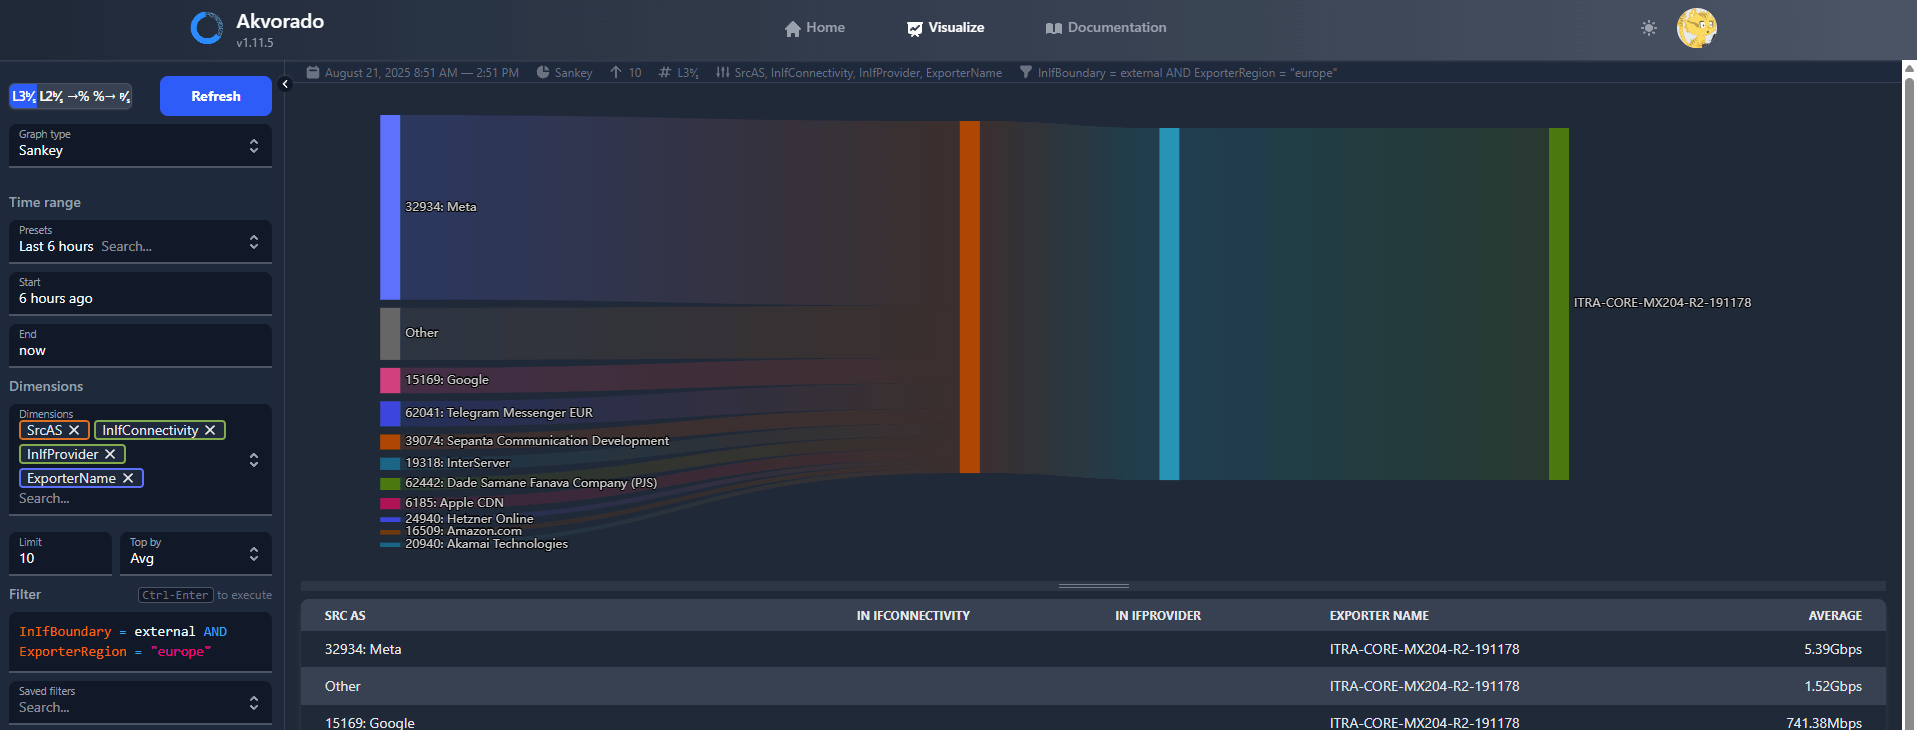
The web interface offers data in graphical, tabular, and map formats, making it easy to filter information, identify anomalies, and conduct in-depth analysis.
6. Dependencies (Redis, Traefik/Nginx)
Redis is used to cache temporary data, significantly speeding up system performance. Traefik and Nginx act as reverse proxies, directing web traffic to different parts of Akvorado. They ensure secure and efficient access to the system's resources.
Part 2: Getting Started – Quickstart Method
The easiest way to get started with Akvorado is by using the official quickstart script. It automatically downloads and sets up all the necessary files. To do this, follow these steps:
-
Download and Installation: Open a terminal and run the following command. This will create a new akvorado directory containing all the required files:
curl -sL https://github.com/akvorado/akvorado/releases/latest/download/docker-compose-quickstart.tar.gz | tar zxvf -Launch Akvorado: Switch to the newly created directory and run Docker Compose. Make sure you have Docker installed first; if not, install it along with the compose plugin:
cd akvorado
docker-compose up -d
And that’s it! Akvorado is now up and running. But to fully understand how it works, let’s take a look at what’s inside the files.
Part 3: Understanding All Configuration Files
Akvorado’s Configuration is Stored in Two Main Files: docker-compose.yml and akvorado.yml.
docker-compose.yml: Managing the Infrastructure
This file serves as the “conductor” for the entire system, specifying which services need to be launched, how they are interconnected, which ports should be opened, and where data should be stored.
-
Ports: The akvorado-inlet section defines the ports on which Akvorado listens for incoming traffic. By default, these are 2055/udp (for NetFlow), 6343/udp (for sFlow), and 4739/udp (for IPFIX).
-
Volumes: This file manages how data is stored on disk. For example, the line akvorado-geoip:/usr/share/GeoIP:ro mounts the akvorado-geoip volume into the akvorado-orchestrator container.
akvorado.yml: Internal Settings
This file is located in the /config directory and controls the behavior of the Akvorado application itself.
-
Compression in Kafka: The kafka section contains the setting compression-codec: zstd. This is crucial! Using zstd allows for significant space savings and reduced network load, especially with large volumes of traffic.
-
Inlet settings: These settings are stored in a separate file called inlet.yaml, which is included in akvorado.yml. You can find the following settings there:
- listen: :2055 – The port that Inlet listens on for incoming traffic.
- use-src-addr-for-exporter-addr: true – This is an important option if your devices are behind a NAT firewall. It instructs Akvorado to use the IP address of the packet sender (i.e., your router) as the exporter’s address.
-
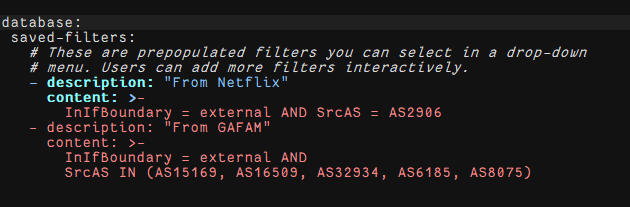
Classifiers: The core section in inlet.yaml contains powerful tools for automatically enriching data.
- exporter-classifiers: Allows for the automatic classification of devices (exporters) based on their characteristics.
- interface-classifiers: Uses regular expressions to automatically determine whether a network interface is external or internal. This simplifies traffic analysis.
Part 4: How to Solve GeoIP Issues – Detailed Guide
We often encounter problems with setting up GeoIP correctly. Docker containers may not be able to access files downloaded to the local machine due to differences in file systems. To resolve this issue, you can use one of the following methods:
Method 1: Automatic (Recommended)
This method involves using a separate Docker service to automatically download MaxMind databases (available for free). Create a file called .env with your account ID and license key from MaxMind.
Example content for .env:
GEOIPUPDATE_ACCOUNT_ID=YOUR ACCOUNT ID
GEOIPUPDATELICENSE_KEY=YOUR LICENSE KEY
Next, use the docker-compose-maxmind.yml file. This file defines a geoip service that automatically downloads the databases to a designated Docker volume and then mounts it in the Akvorado container.
Method 2: Manual (for Debugging)
If you want to use files that were downloaded manually, you need to explicitly mount the local directory into the container. To do this, modify the docker-compose.yml file: replace the named volume with a bind mount (mounting a directory from the host).
# Replace the named volume with:
# - akvorado-geoip:/usr/share/GeoIP:ro
# Use a bind mount instead:
# - /path/to/your/directory:/usr/share/GeoIP:ro
Don’t forget to remove the volume definition afterward: make sure to delete the line akvorado-geoip: from the volumes section.
Part 5: Final Steps
After installing Akvorado, perform the following steps:
- Check the containers: Ensure that all containers are running by using the docker-compose ps command.
- Verify access: The web interface can be accessed at the address http://<your_server_ip>:8081.
- Configure devices: This is the final and most important step: configure your routers or switches to direct network traffic to your Akvorado server’s IP address.
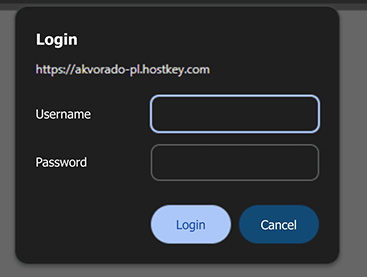
And what about security?
In the basic “quickstart” configuration, the Akvorado web interface is accessible without a password. To protect it, you can use htpasswd, which is commonly used for authentication in Nginx and Apache.
Step 1: Install httpd-tools
First, you’ll need the htpasswd utility. Depending on your Linux distribution, you can install it as follows:
For RHEL / Fedora / CentOS:
sudo dnf install httpd-tools -yFor Debian / Ubuntu:
sudo apt-get install apache2-utils -yStep 2: Create the .htpasswd file
Create a .htpasswd file in a directory that will be accessible to Docker Compose. A good place to put this file is your Akvorado working directory. To do this, run the following command in the console:
touch /akvorado/docker/.htpasswdStep 3: Generate login credentials
Use the htpasswd command to create a username and password pair:
sudo htpasswd -c /akvorado/docker/.htpasswd adminHere’s what each part of the command does:
- sudo htpasswd -c: This starts the utility in mode that creates a new file.
- /akvorado/docker/.htpasswd: The path to the file where the credentials will be stored.
- admin: The name of the user you’re creating.
The command will ask you for a password, which will then be encrypted and saved in the file.
Why should I switch to Akvorado?
Akvorado stands out from other solutions such as ntopng, Grafana Flow, and ElastiFlow due to its approach to architecture and data processing. Let’s compare them:
|
Akvorado |
ntopng |
Grafana Flow |
ElastiFlow |
|
|---|---|---|---|---|
|
Architecture |
Distributed (Inlet, Kafka, Orchestrator, ClickHouse). |
Monolithic. |
Combination of Grafana + Telegraf + InfluxDB/Prometheus. |
Distributed (Logstash, Elasticsearch, Kibana). |
|
Scalability |
High. Easily scalable horizontally using Kafka and ClickHouse. |
Low. Limited by the resources of a single server. |
Medium. Depends on database configuration. |
High. Based on the ELK stack. |
|
Performance |
Excellent. ClickHouse enables immediate access to large amounts of data. |
Good. Sufficient for small networks. |
Depends on the database and data volume. |
Good; may be slower with large volumes due to Elasticsearch. |
|
Data “Enrichment” |
Built-in and flexible. Supports GeoIP, ASN, SNMP, and custom classifications. |
Basic (only GeoIP). |
Basic; requires additional configuration. |
Built-in (GeoIP, ASN). |
|
Configuration Complexity |
Medium. Requires knowledge of Docker Compose and YAML files. |
Low. Simple installation. |
Medium. Multiple components need to be configured. |
High; the ELK stack is complex to set up. |
|
Best Use Cases |
For any network that requires detailed analysis, high performance, and scalability. |
For small networks, home use, and quick setup. |
For those already using the Grafana ecosystem. |
For those already using the ELK stack. |
The key advantage of Akvorado is its use of ClickHouse. Unlike Elasticsearch, which is optimized for full-text searches, ClickHouse is designed specifically for ultra-fast analytical queries on large amounts of structured data. This allows Akvorado to deliver performance that many other solutions cannot match, especially in large-scale projects.
Here are several additional reasons why Akvorado could become your preferred monitoring tool:
- Ease of use: Its simplicity hides its powerful capabilities. You can set it up in minutes using a quickstart script, allowing you to quickly evaluate all its features without spending hours on complex setup.
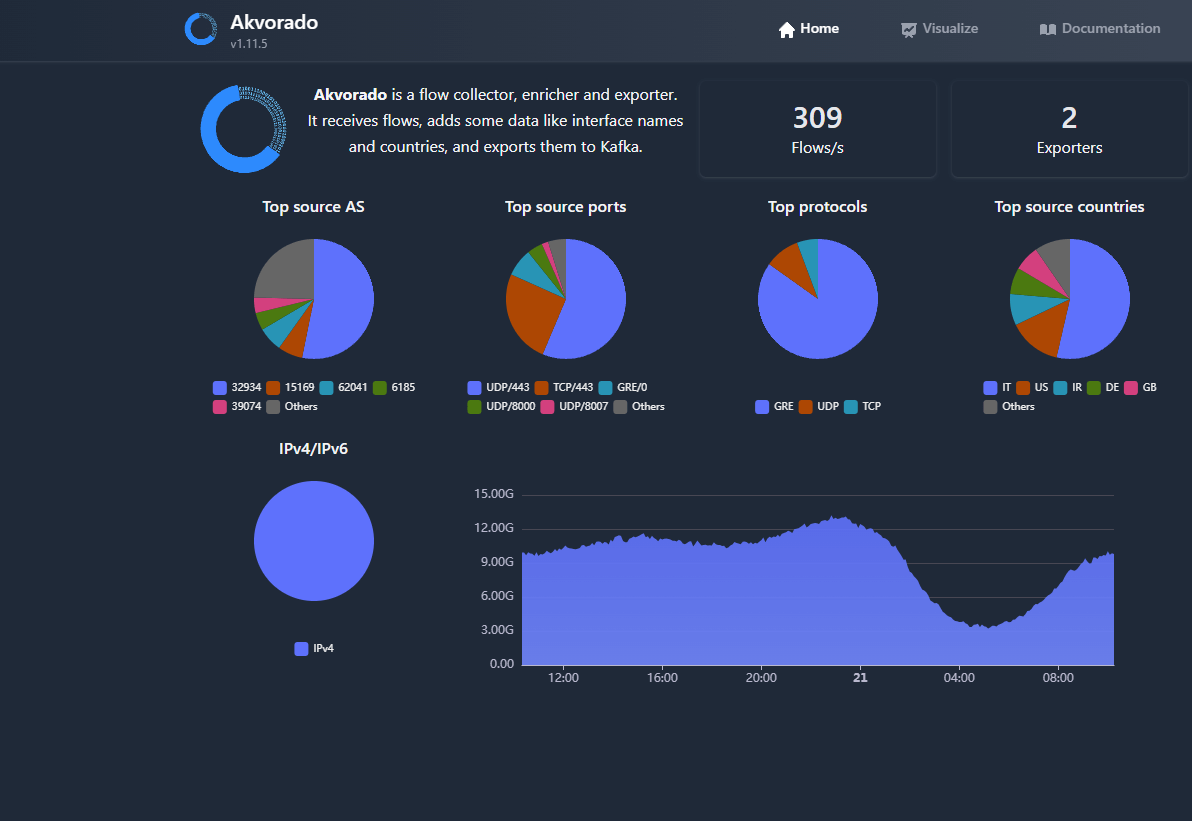
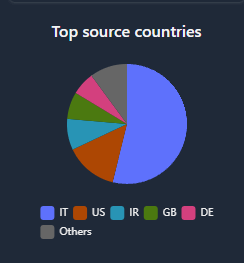
- Intuitive visual analysis: Akvorado automatically enriches data with geographic information and system IDs, providing immediate insights into traffic sources on a map—no additional steps required. This transforms raw data into an easily understandable visual representation.
- Ideal for learning: If you’re new to network traffic analysis, Akvorado is an excellent tool for understanding how network analytics works. It clearly demonstrates how valuable information can be extracted from data packets.
- High performance: Even on regular laptops, Akvorado runs fast thanks to its use of ClickHouse, a database optimized for analytical queries, enabling you to analyze large amounts of data without delays.
In summary:
Akvorado offers a modern approach to network traffic analysis that overcomes the main challenges of traditional solutions—complex setup and deployment. What used to take days is now handled with just a few commands. Its microservice-based architecture makes it flexible and scalable, with each component performing a specific task efficiently.
While there are some limitations (the system is still new, the community is small, and documentation needs improvement), Akvorado’s capabilities are more than sufficient for most corporate networks. Its advanced technology and low entry barrier make it a strong candidate for deployment in production environments.
So, what monitoring and traffic visualization tool do you use—and why?