
Author: Artem Zubkov, Junior DevOps Administrator.
In modern distributed systems, the reliability and security of infrastructure depend directly on the proper functioning of cryptographic components, especially SSL/TLS certificates. A crucial aspect of system operation is the timely monitoring of certificate expiration dates; failure to do so can lead to service disruptions, API unavailability, authentication errors, and even security breaches in connections. Within the oVirt Engine ecosystem, which serves as a central hub for managing virtual infrastructure, SSL certificates are particularly important, as they ensure secure communication between system components and end-users.
In this article, we will discuss the implementation of automated monitoring for the expiration dates of two critical certificates: apache.cer and websocket-proxy.cer, which are located in the /etc/pki/ovirt-engine/certs/ directory on each oVirt Engine.
The apache.cer certificate is used by the Apache web server, which serves the oVirt Engine’s web interface and REST API, ensuring encryption and authentication of client connections. The websocket-proxy.cer certificate is used to secure WebSocket connections required for transferring virtual machine console sessions via a browser. Failing to update these certificates in a timely manner can result in the inability to manage virtual machines and the administrative interface, making their monitoring a priority task.
To address this issue, we developed a specialized exporter called cert_checker, which is installed directly on each oVirt Engine in the /opt/certchecker directory. For those who may not be familiar with it, oVirt Engine is a central management server that oversees all virtualization nodes, shared disk resources, and virtual networks.
The cert checker analyzes the specified certificate files, extracts their expiration dates, and provides metrics in a format compatible with Prometheus. This allows us to integrate the monitoring process into existing metric collection and visualization systems, set up alerts several days before the certificates expire, and respond promptly to potential issues.
For the cert checker to function correctly, it is essential that the Go (golang) version installed on the host is not lower than the one used during its compilation, ensuring the stability and compatibility of the executable file. The article will go on to provide a detailed description of the solution’s architecture, the deployment process, the format of the metrics provided, and recommendations for integrating it into the monitoring infrastructure.
Creating a Service
In addition to the exporter, it is also necessary to create a systemd service for it to run automatically. To do this, navigate to the /etc/systemd/system/ directory and create a new systemd-unit file with the following content:
Description="oVirt cert checker service"
ConditionPathExists="/opt/cert_cheker"
After="network.target"
[Service]
Type=simple
WorkingDirectory=/opt/cert_cheker
ExecStart="/usr/local/go/bin/go run main.go"  # Specify the path to the Go binary and the command to execute it
User=root
ExecReload="/bin/kill -HUP $MAINPID"
ExecStop="/bin/kill $MAINPID"
KillSignal=SIGQUIT
TimeoutStopSec=5
Restart=on-failure
RestartSec=10
[Install]
WantedBy=multi-user.target
Once the file is created, execute
systemctl daemon-reloadto apply the changes, then start the service using
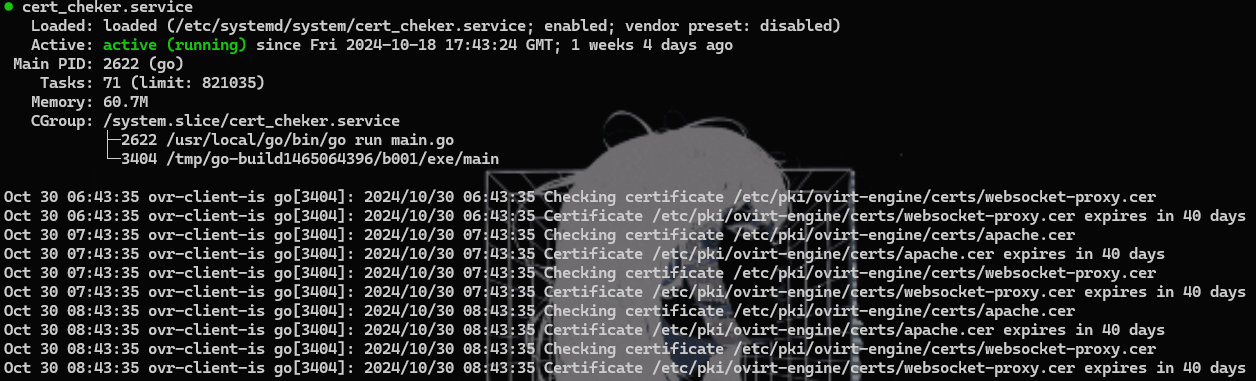
systemctl start cert_cheker.serviceFinally, check the service’s status with
systemctl status cert_cheker.serviceIf successful, the output should display the service’s current status.
It’s also necessary to ensure that the port we need (port 1337) is not blocked by the firewall. To check this, you can run the following command:
netstat -na | grep 1337If the output looks similar to the following:

In that case, you need to open the port manually by entering the following command:
firewall-cmd --add-port 1337/tcpWe then check the result:

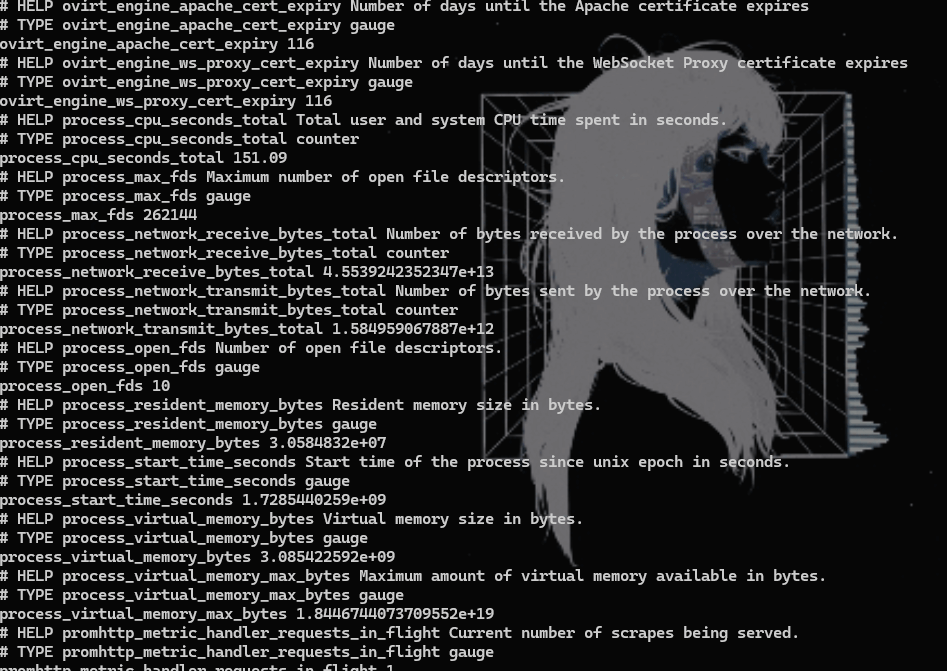
If the port is successfully opened, we need to verify whether any metrics are being collected for that port. To do this, enter the following command:
curl http://localhost:1337/metricsYou should receive an output similar to the one shown in the screenshot below.
Creating a Prometheus Alert
First, we need to create an alert. For all the examples, we will be referring to our GitLab repository and the Ansible playbooks used for infrastructure deployment, which are located there. For Prometheus, you can find the alerts in the path /devops/ansible-playbooks/prometheus_playbook/files/alerts.
We choose the New file menu item and create a file in YAML format.
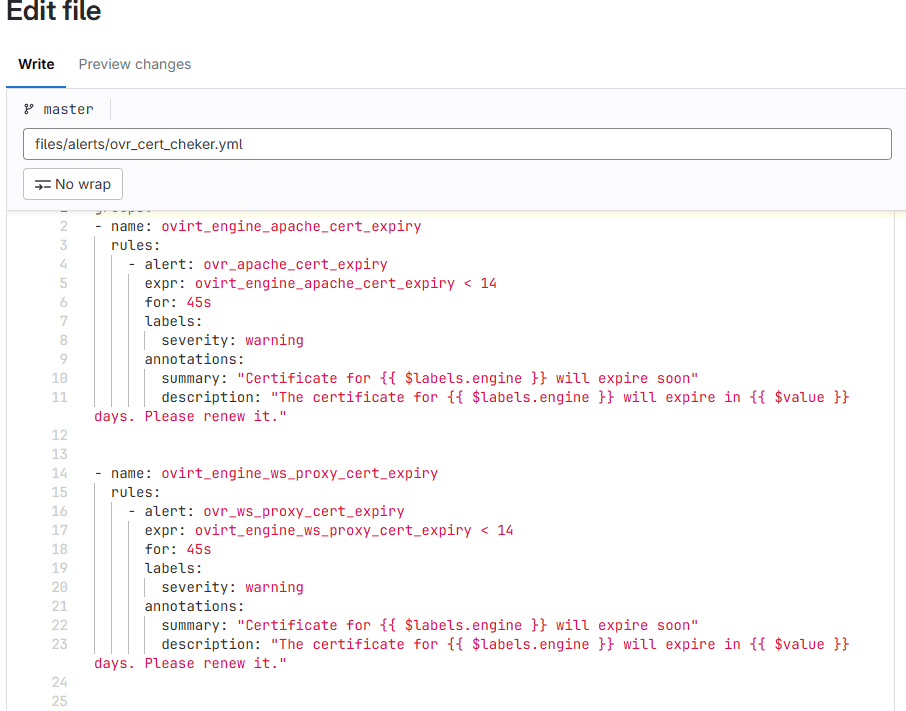
Next, we need to create an alert that specifies the name of the alert itself, the attribute to be monitored, the value at which the alert should trigger, the update interval, the type of alert (in our case, warning), and a description of the alert. The format is as follows:
groups:
- name: ovirt_engine_apache_cert_expiry
  rules:
    - alert: ovr_apache_cert_expiry
      expr: ovirt_engine_apache_cert_expiry < 14
      for: 45s
      labels:
        severity: warning
      annotations:
        summary: "Certificate for {{ $labels.engine }} will expire soon"
        description: "The certificate for {{ $labels.engine }} will expire in {{ $value }} days. Please renew it."
- name: ovirt_engine_ws_proxy_cert_expiry
  rules:
    - alert: ovr_ws_proxy_cert_expiry
      expr: ovirt_engine_ws_proxy_cert_expiry < 14
      for: 45s
      labels:
        severity: warning
      annotations:
        summary: "Certificate for {{ $labels.engine }} will expire soon"
        description: "The certificate for {{ $labels.engine }} will expire in {{ $value }} days. Please renew it."
We save the changes and then navigate to the /devops/ansible-playbooks/prometheus_playbook/group_vars directory. Our interest is in the federation_lang.yaml file. We open it using a web-based IDE, and at the top of the document (near the other targets), we create our own target as follows:
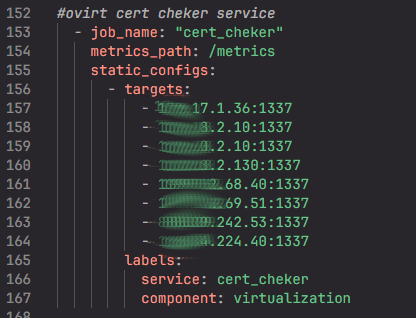
The target includes the name of the target itself, as well as the path to the directory that is hosted on port 1337 (which was configured earlier). Next, after the static_configs section, we specify the target addresses for port 1337. After that, under the labels section, we provide the name of the service and the component virtualization.
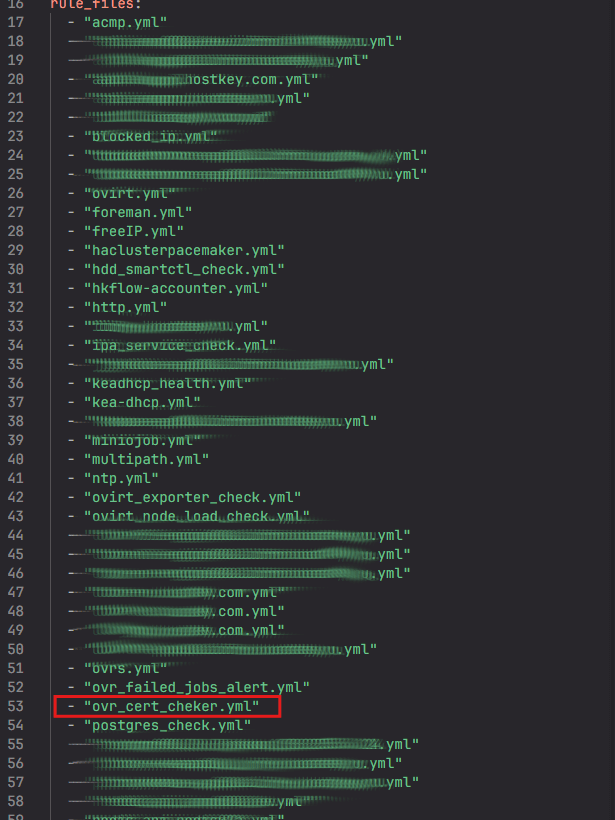
Additionally, at the very beginning of the document, immediately after the rule_files field, we need to specify the name of the alert that was created earlier.
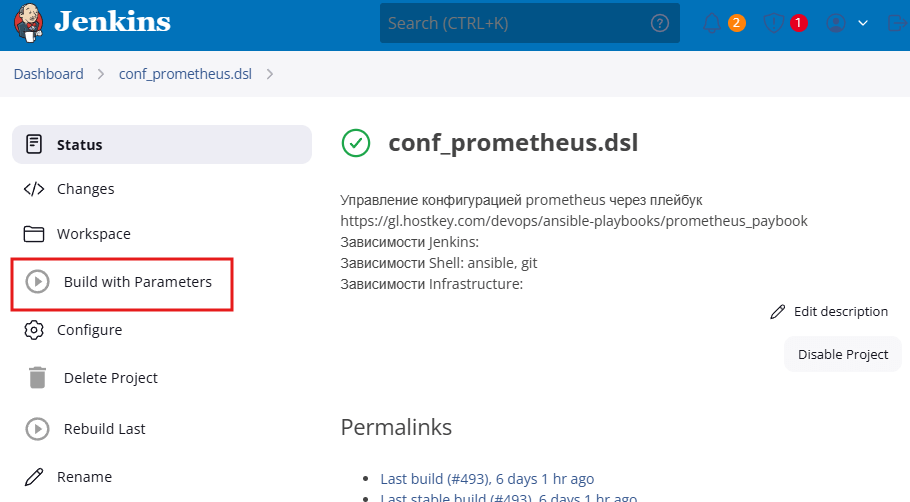
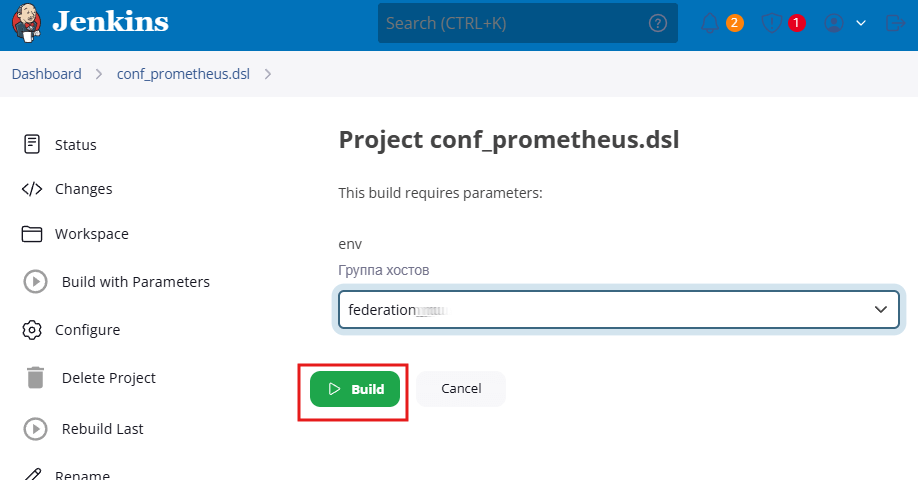
After that, we proceed to the Jenkins task conf/prometheusdsl and initiate the update for the federation_lang file.
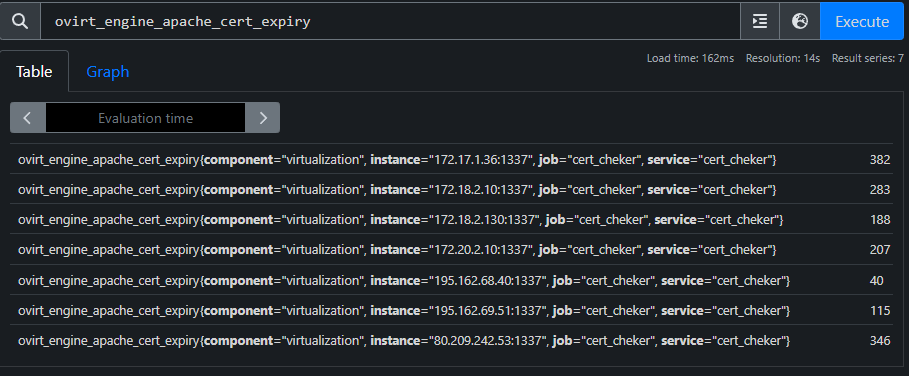
After the successful update, we should navigate to the URL (http://<ip>:9090/) and test the target by entering the name of the attribute we’re looking for, such as ovirt_engine_apache_certexpiry. If there are no issues, the output should look similar to this:
Displaying the Alert on the Grafana Dashboard
If all previous steps were successfully executed, the alert will be displayed on the main dashboard. To move it to the oVirt dashboard, follow these steps:
Navigate to the panel settings and click on the Edit option from the menu.
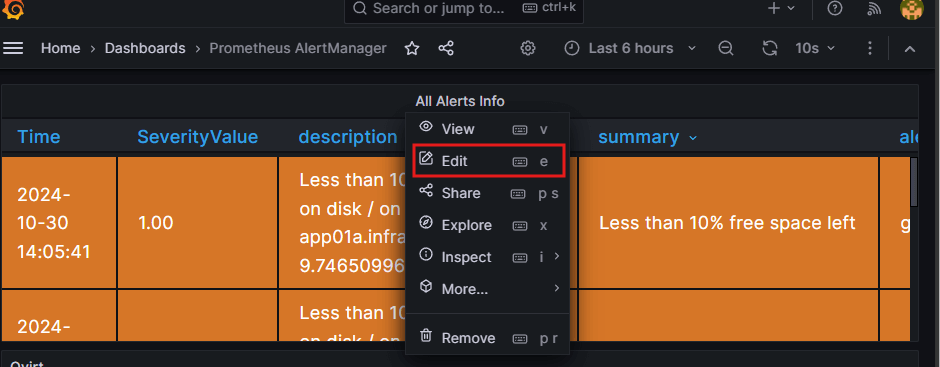
We need to enter the alert name in the format job!="cert_cheker". Make sure to include a comma after it. If the name is entered in the middle of the field, place commas on both sides of it.

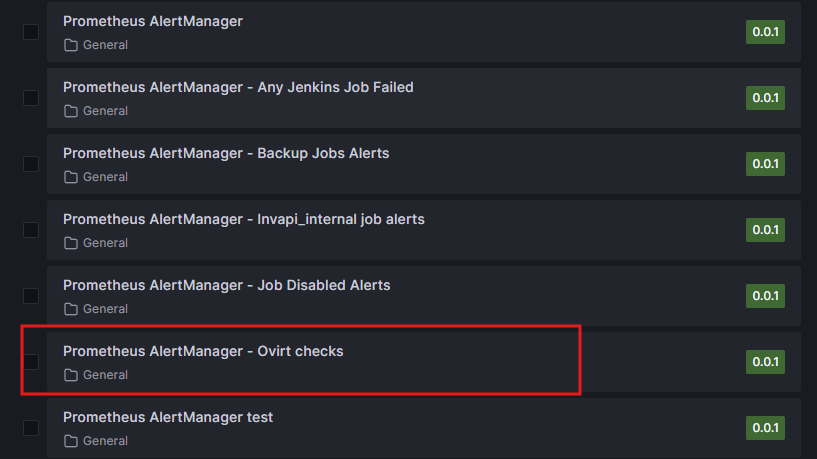
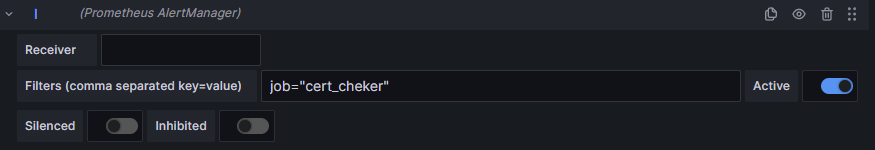
Next, we proceed to the Prometheus AlertManager dashboard – specifically, the Ovirt Checks section:
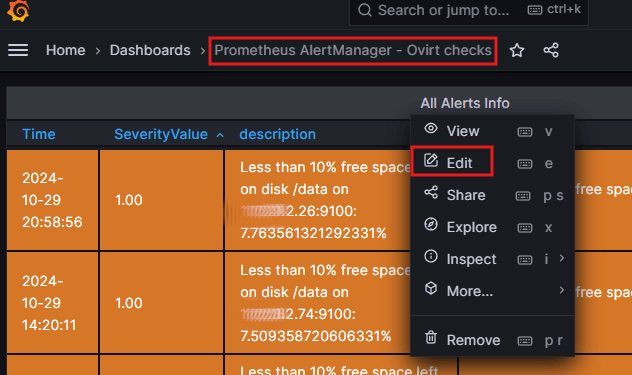
On the oVirt dashboard, we return to the panel settings again:
Now, click on the +Query:
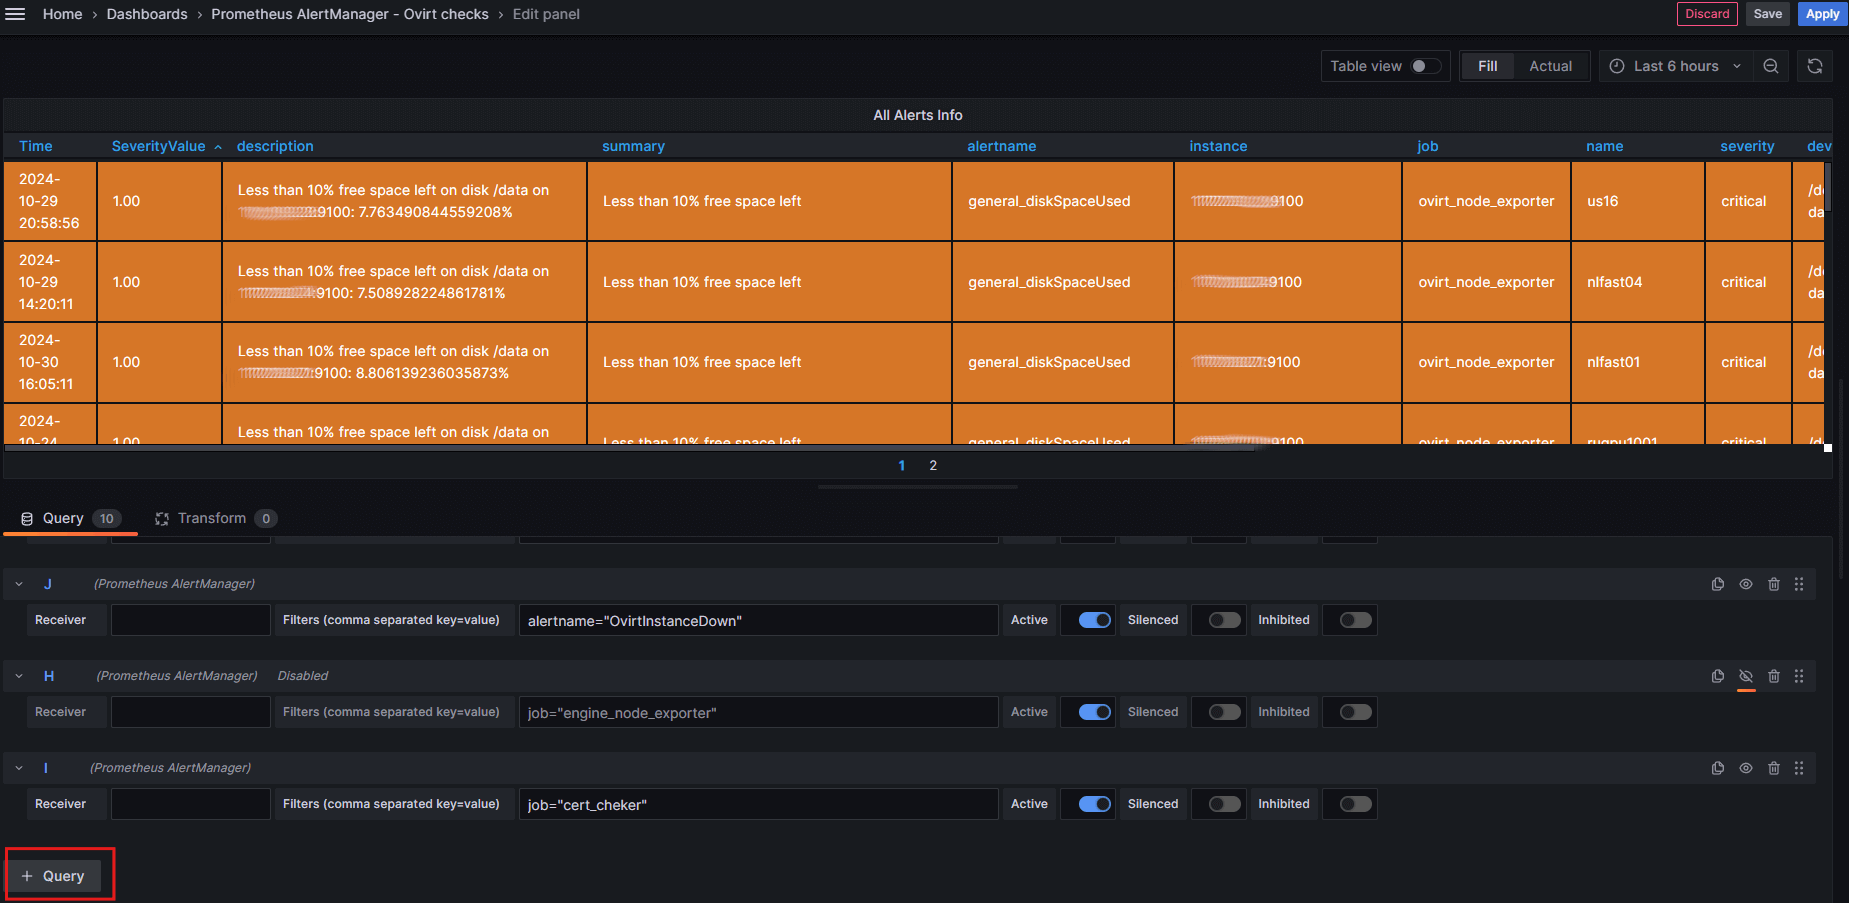
In the field that appears, enter the alert name again in the format job="cert_cheker".
Next, click on Save at the top of the page.

As a result of the actions taken, the alert will be displayed on the oVirt dashboard, and the setup can be considered complete.
Description of the Exporter Code's Functioning:
Initially, the necessary packages are imported, including crypto/x509 for working with certificates. The crypto/x509 package is crucial as it provides functions for parsing X.509 certificates and checking their validity periods.
Additionally, the following packages are required: encoding/pem for decoding PEM-encoded data, io for input/output operations, log for logging, net/http for handling HTTP requests, os for interacting with the operating system, and time for working with time-related functions.
It is also necessary to import packages from external libraries:
- github.com/prometheus/client_golang/prometheus for working with Prometheus.
- github.com/prometheus/client_golang/prometheus/promhttp for handling Prometheus HTTP requests.
package main
import (
    "crypto/x509"
    "encoding/pem"
    "io"
    "log"
    "net/http"
    "os"
    "time"
    "github.com/prometheus/client_golang/prometheus"
    "github.com/prometheus/client_golang/prometheus/promhttp"
)
Next, two metrics are defined: apacheCertExpiry and wsProxyCertExpiry. These metrics serve as indicators (gauges) in Prometheus and are used to monitor the number of days remaining until the expiration dates of the Apache and WebSocket Proxy certificates, respectively.
var (
    apacheCertExpiry = prometheus.NewGauge(prometheus.GaugeOpts{
        Name: "ovirt_engine_apache_cert_expiry",
        Help: "Number of days until the Apache certificate expires",
    })
    wsProxyCertExpiry = prometheus.NewGauge(prometheus.GaugeOpts{
        Name: "ovirt_engine_ws_proxy_cert_expiry",
        Help: "Number of days until the WebSocket Proxy certificate expires",
    })
)
Within the init() function, these metrics are registered with Prometheus using the prometheus.MustRegister() method.
func init() {
    prometheus.MustRegister(apacheCertExpiry)
    prometheus.MustRegister(wsProxyCertExpiry)
}
Within the main() function, an HTTP server is initiated and set up to run on port 1337. This server is designed to receive data in the form of metrics from a specific directory (/metrics) using a format that is compatible with Prometheus.
func main() {
    log.Println("Starting HTTP server on :1337")
    http.Handle("/metrics", promhttp.Handler())
    go func() {
        log.Fatal(http.ListenAndServe(":1337", nil))
    }()
Next, in an infinite loop, the validity period of Apache certificates and WebSocket Proxy certificates is checked every hour using the checkCertExpiry() function. This function takes the path to the certificate file as an argument and returns the number of days remaining until the certificate expires. If the number of days until expiration is 0 or more, the value of the corresponding metric is updated using the Set() function.
 for {
        apacheDaysUntilExpiry := checkCertExpiry("/etc/pki/ovirt-engine/certs/apache.cer")
        if apacheDaysUntilExpiry >= 0 {
            apacheCertExpiry.Set(float64(apacheDaysUntilExpiry))
        }
        wsProxyDaysUntilExpiry := checkCertExpiry("/etc/pki/ovirt-engine/certs/websocket-proxy.cer")
        if wsProxyDaysUntilExpiry >= 0 {
            wsProxyCertExpiry.Set(float64(wsProxyDaysUntilExpiry))
        }
        time.Sleep(1 * time.Hour)
    }
}
If it is not possible to determine the validity period of a certificate, the function returns -1.
func checkCertExpiry(certFile string) int {
    log.Printf("Checking certificate %s\n", certFile)
    file, err := os.Open(certFile)
    if err != nil {
        log.Printf("Failed to open certificate %s: %v", certFile, err)
        return -1
    }
    defer file.Close()
    certData, err := io.ReadAll(file)
    if err != nil {
        log.Printf("Failed to read certificate %s: %v", certFile, err)
        return -1
    }
    block, _ := pem.Decode(certData)
    if block == nil {
        log.Printf("Failed to decode PEM block for %s", certFile)
        return -1
    }
    cert, err := x509.ParseCertificate(block.Bytes)
    if err != nil {
        log.Printf("Failed to parse certificate %s: %v", certFile, err)
        return -1
    }
    daysUntilExpiry := int(cert.NotAfter.Sub(time.Now()).Hours() / 24)
    log.Printf("Certificate %s expires in %d days\n", certFile, daysUntilExpiry)
    return daysUntilExpiry
}
Inside the checkCertExpiry() function, the certificate file is first opened using the os.Open() function. The contents of the file are then read using io.ReadAll(). The certificate data is decoded from PEM format using pem.Decode(), and subsequently parsed into an x509.Certificate structure with x509.ParseCertificate().
Next, the number of days until the certificate expires is calculated by subtracting the current time from the expiration date specified in the certificate. The result is converted to a positive integer representing the number of days left before expiration. This value is then returned by the checkCertExpiry() function.
Summary
In the process of implementing SSL/TLS certificate monitoring within the oVirt ecosystem, we developed a reliable and automated solution based on a custom-certchecker exporter. This tool enables real-time tracking of the expiration dates for critical certificates, such as apache.cer and websocket-proxy.cer, thereby preventing potential disruptions to web interfaces and console connections to virtual machines.
The integration with Prometheus and Grafana provided us with centralized monitoring capabilities, and the configuration of alerts allowed us to respond promptly when certificate expiration was approaching—14 days in advance, rather than at the last moment.
The fully automated process from metric collection to visualization and notification improved the infrastructure's resilience and reduced operational risks associated with human error (and, as a result, enhanced the quality of our services).
Considering several months of deployment since the initial implementation, we can conclude that the solution was simple yet effective. By utilizing standard Go libraries and the Prometheus ecosystem, we created a flexible and easy-to-maintain component that can be quickly adapted to different types of certificates or systems. Most importantly, the monitoring has become proactive; instead of reacting to incidents after they occur, we can now prevent them from happening in the first place.
How do you organize certificate monitoring in your own infrastructure?