Percona Monitoring
In this article
Note
Percona Monitoring and Management 2 (PMM2) is an advanced open-source platform for monitoring and managing database performance. It provides a comprehensive solution for observing the operation of various databases, including MySQL, MongoDB, PostgreSQL, and others. The platform is optimized for efficient resource utilization and supports containerization, simplifying deployment and updates. PMM2 helps database administrators and developers identify performance issues, optimize queries, and ensure stable operation of enterprise-scale database management systems.
Percona Monitoring: Key Features
- Comprehensive Monitoring: Real-time collection and analysis of performance metrics for various databases, including MySQL, MongoDB, PostgreSQL.
- Data Visualization: Customizable dashboards for a clear visual representation of key performance indicators.
- Query Analysis: Detailed analysis and optimization of SQL queries, including execution plan review.
- Historical Analytics: Tracking long-term performance trends to identify anomalies and plan resources.
- Alerting System: Customizable notifications about critical situations and deviations from the norm.
- Security Management: Built-in role-based access control (RBAC) system and support for SSL/TLS.
- Scalability: Efficient operation with large distributed database systems.
- Integration and Extensibility: API for integration with other tools and the ability to create custom metrics.
Deployment Features
| ID | Name of Software | Compatible OS | VM | BM | VGPU | GPU | Min CPU (Cores) | Min RAM (Gb) | Min HDD/SDD (Gb) | Custom Domain | Active |
|---|---|---|---|---|---|---|---|---|---|---|---|
| 147 | Percona Monitoring and Management | Ubuntu 22.04 | + | + | + | + | 1 | 1 | - | No | ORDER |
Note
Unless otherwise specified, by default we install the latest release version of software from the developer's website or operating system repositories.
Getting Started After Deploying Percona Monitoring
After you purchase an order, you'll receive a notification email with the server ready for use. This will include the VPS IP address, login, and password. Our company clients manage their equipment through the server control panel and API — Invapi.
You can find the authorization data in either the Info >> Tags tab of the server control panel or in the sent email:
- Link to access the Percona Monitoring web interface: in the webpanel tag;
- Login:
admin; - Password:
admin.
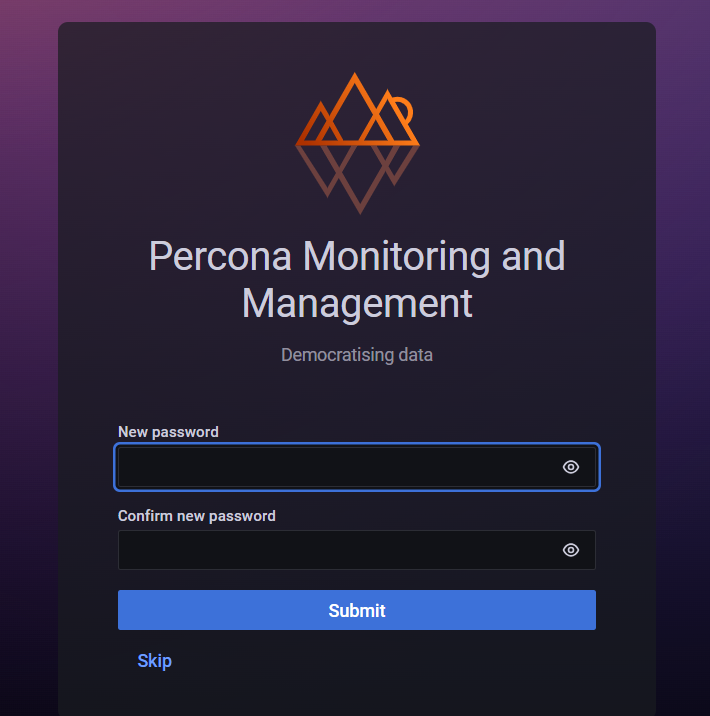
After successful authorization in the Percona Monitoring panel, it is highly recommended to change the administrator password for system security. The password change menu will appear automatically:

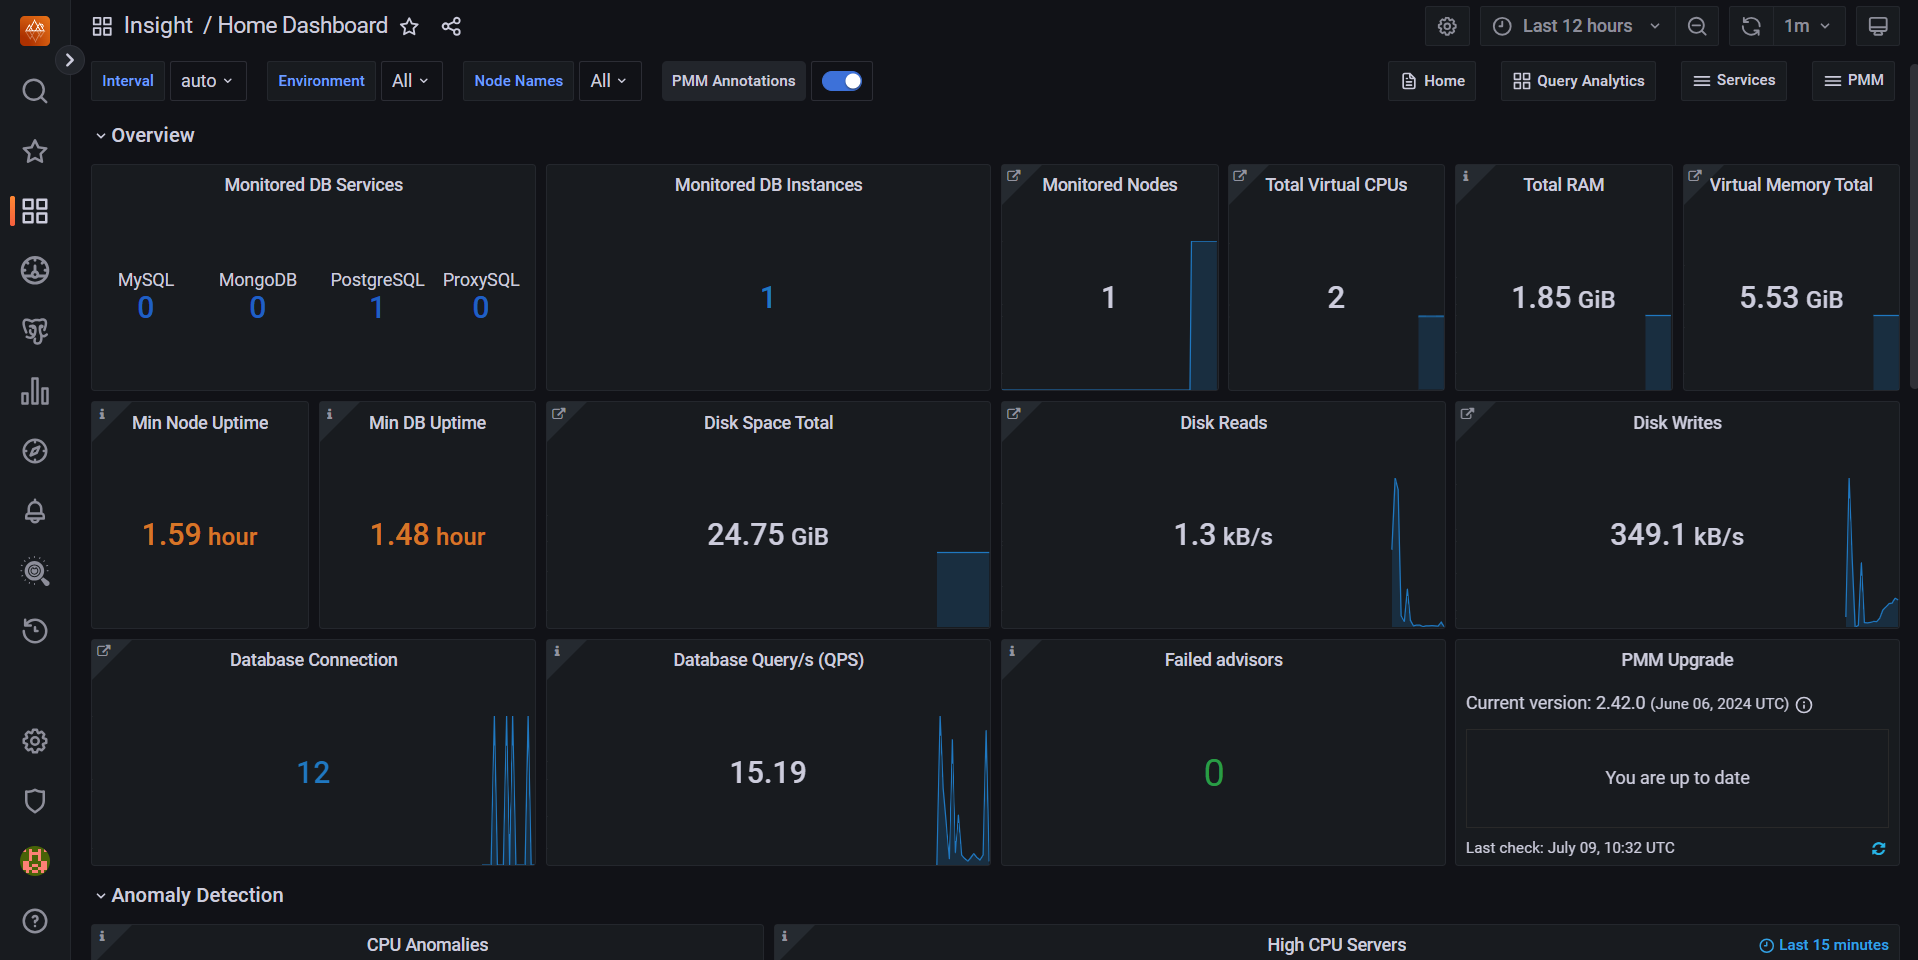
After changing the password, you'll be redirected to the Percona Monitoring web interface home screen:

The top panel allows you to configure time intervals, environment, and other display parameters. The "Overview" section displays key metrics:
- Types and number of monitored databases;
- Number of database instances and nodes;
- CPU, RAM, and virtual memory usage;
- Node and database uptime;
- Disk space usage and read/write activity;
- Number of database connections and queries per second;
- Update status and issues.
The graphs at the bottom display CPU anomalies and servers with high CPU load. The left sidebar allows you to switch between different monitoring sections.
Note
Detailed information on basic Percona Monitoring settings can be found in the developer documentation.
Configuring SSL Certificates for Containerized Applications Using Certbot
Note
The process of issuing SSL certificates for the PMM server is built on using a Docker container that hosts PMM and the Certbot tool for automatic certificate acquisition from Let’s Encrypt. More details about the process of instant issuance and updating SSL certificates from Let's Encrypt are described in the article Free Domain Certbot
If you need to recreate a container with your application, it is important to ensure the preservation of SSL certificates and their correct integration with the container environment. The process outlined below details manual installation and configuration of Certbot, as well as the issuance and use of SSL certificates, allowing for secure connection to your application even after changes to the container configuration.
Step 1: Installing Certbot
First, you need to install Certbot within your container. To do this, run the following command on the server:
Step 2: Issuing Certificates
After installing Certbot, you can proceed to issue certificates. Run the following command, specifying your domain and email for notifications:
Replace <your_email> with your active email address to receive notifications about certificate status, and <your_domain> with the name of your domain (e.g., example.com).
Note
If you don't want to specify an email, you can add the --register-unsafely-without-email flag, but this is not recommended as you won't receive notifications about certificate renewal deadlines.
Step 3: Moving Certificates
To integrate certificates with Nginx in the container, you need to move the certificate files to the correct directories. Run the following commands:
docker exec -i pmm-server cp /etc/letsencrypt/live/<your_domain>/cert.pem /srv/nginx/certificate.crt
docker exec -i pmm-server cp /etc/letsencrypt/live/<your_domain>/privkey.pem /srv/nginx/certificate.key
docker exec -i pmm-server cp /etc/letsencrypt/live/<your_domain>/fullchain.pem /srv/nginx/ca-certs.pem
docker exec -i pmm-server cp /etc/letsencrypt/ssl-dhparams.pem /srv/nginx/dhparam.pem
Step 4: Restarting Nginx
To apply the new certificates, you need to restart the Nginx service inside the container. To do this, run:
Ordering a server with Percona Monitoring using the API
To install this software using the API, follow these instructions.
Some of the content on this page was created or translated using AI.